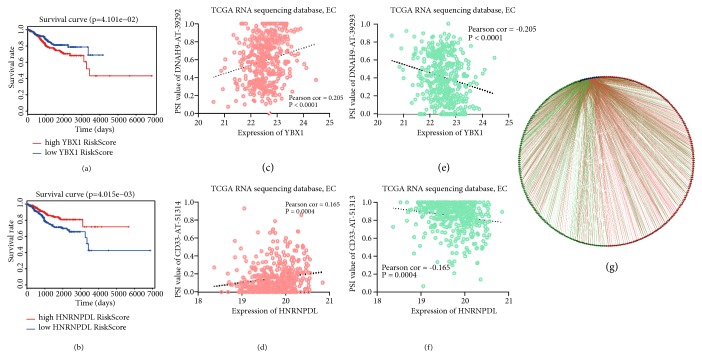
Figure 4.
Correlation between prognosis-related splicing factors and PASEs in EC. (a, b) K-M survival curves of YBX1 and HNRNPDL, divided into high (red line), low (green line) group according to median expression value of splicing factor. (c, e) Correlation analysis between expression of YBX1 and PSI values of DNAH9-AT-39292, DNAH9-AT-39293. (d, f) Correlation analysis between expression of HNRNPDL and PSI values of CD33-AT-51314, CD33-AT-51313. (g) Correlation network between prognosis-related splicing factors and PSI values of alternative splicing events, blue dots represent splicing factors, green/red dots represent favorable/poor prognostic alternative splicing events, respectively, and red/green lines represent positive/negative correlations, respectively.

