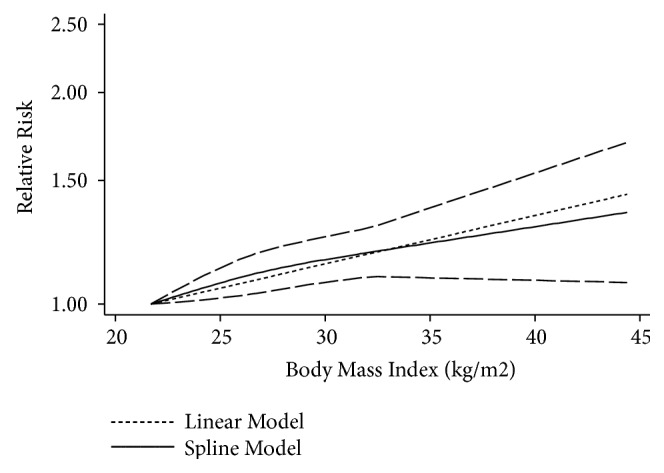
Figure 4.

The dose-response analysis between BMI and rheumatoid arthritis risk in studies with restricted cubic splines in a multivariate random-effects dose-response model. The solid line and the long dashed line represent the estimated RR and its 95% CI. The short dashed line represents the linear relationship (per 5 kg/m2 increment). RR, relative risk; CI, confidence interval; BMI, body mass index.
