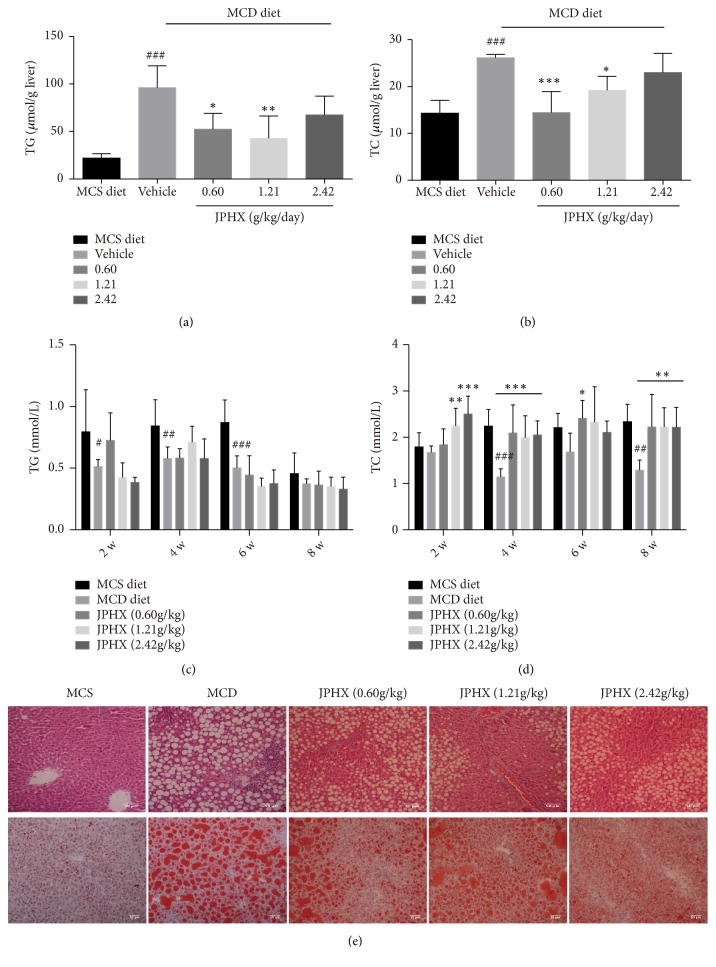
Figure 2.
Effect of JPHX on accumulation of hepatic TG and TC induced by MCD diet and liver histology. (a) Liver TG levels. (b) Liver TC levels. (c) Serum TG levels. (d) Serum TC levels. (e) H&E and Oil red O staining of representative liver sections from each treatment group. Original magnification × 200. Values are shown as the mean ± SD. MCS n=6, MCD n=9, and JPHX treatment groups n=7. #p<0.05, ##p<0.01, and ###p<0.001, MCD diet vehicle group versus MCS diet group. ∗p<0.05, ∗∗p<0.01, and ∗∗∗p<0.001, MCD diet vehicle group versus JPHX treatment groups.

