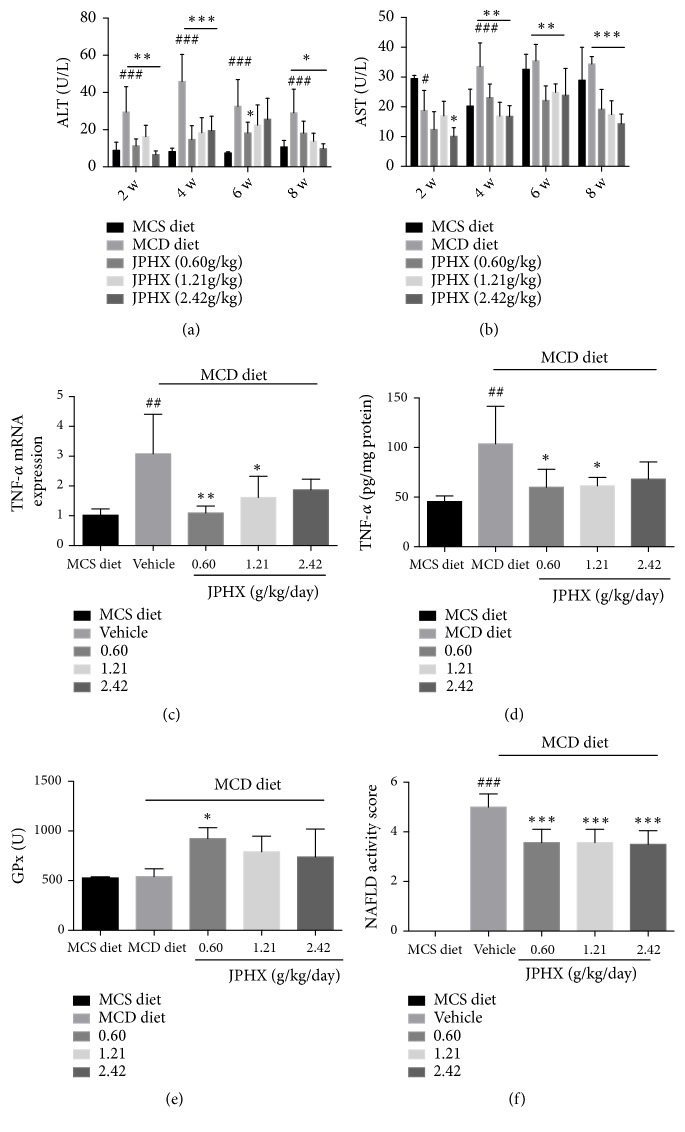
Figure 3.
Liver injury-related parameters, inflammation-related parameters, and NAS score. (a) Serum ALT levels in rats fed with MCD or MCS diet at weeks 2, 4, 6, and 8. (b) Serum AST levels. (c) TNF-α mRNA expression levels were detected by qRT-PCR; data were normalized to β-actin. (d) Hepatic TNF-α concentrations were measured by an ELISA kit. (e) Effects of JPHX formula on liver GPx in rats. (f) NAFLD activity scores were analyzed by a pathologist in a blind manner. Values are shown as the mean ± SD. MCS n=6, MCD n=9, and JPHX treatment groups n=7. #p<0.05, ##p<0.01, and ###p<0.001, MCD diet vehicle group versus MCS diet group. ∗p<0.05, ∗∗p<0.01, and ∗∗∗p<0.001, MCD diet vehicle group versus JPHX treatment groups.

