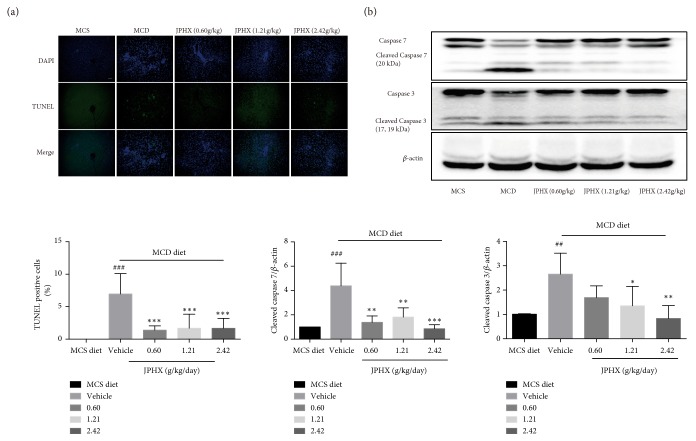
Figure 5.
Analysis of apoptosis in liver sections and effect of JPHX on the expression levels of cleaved forms of caspase 3 and caspase 7. (a) Representative images showed apoptotic cells in the liver of different groups of rats by TUNEL staining and quantification of TUNEL-positive cells. Apoptotic nuclei stained by TUNEL (green) and counterstained with DAPI (blue) to mark nuclei; hepatocytes were imaged by confocal microscope. (b) Representative Western blotting results of total and cleaved forms of caspase 3 and caspase 7. Protein expression levels were normalized to that of β-actin. Values are shown as mean ± SD. MCS n=6, MCD n=9, and JPHX treatment groups n=7. #p<0.05, ##p<0.01, and ###p<0.001, MCD diet vehicle group versus MCS diet group.∗p<0.05, ∗∗p<0.01, and ∗∗∗p<0.001, MCD diet vehicle group versus JPHX treatment groups.

