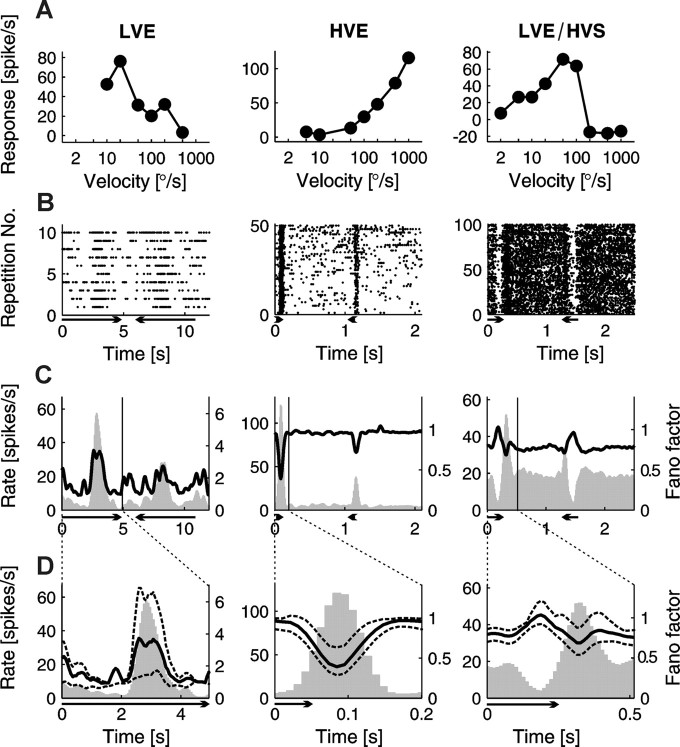
Figure 2.
Responses and FFs calculated for three SC neurons showing different velocity response profiles. Each column represents different type of collicular cell. From left to right, An LVE cell, an HVE cell, and an LVE/HVS cell. A, Velocity tuning curves. As a response level, the difference between the peak of response (maximum discharge rate in case of excitation) or trough (minimum in case of suppression) and background activity was taken. The horizontal axis is in logarithmic scale. B, Raster plots of neuronal responses during all repetitions of stimulus moving with exemplary velocity for a particular cell. One row represents a single response to stimulus movement in both directions. Each dot corresponds to the occurrence of a single spike. Length of the arrow indicates duration of the stimulus and its head the direction of motion. Velocity of the stimulus for the LVE cell is 10°/s, for HVE cell is 1000°/s, and for the LVE/HVS cell is 200°/s. C, Relationship between firing rate (gray histogram) and FF (black solid line) for responses shown in the form of raster plot in B. The left vertical axes indicate the firing rate level, and the right vertical axes indicate the value of FF. Time base of the full PSTH and FF was divided into 200 bins. The region between the “rate” axis and the vertical black line including the time of response is expanded in D. D, Expanded part of cell activity presented in C. Gray histogram is the firing rate, and the black line denotes the FF with black dotted lines standing for error bars. Broad extent of confidence intervals in the case of low velocity excitatory response (left plot) is the effect of the higher trial-to-trial variability. The time axis begins with the stimulus onset. Each plot presents responses to the preferred direction.

