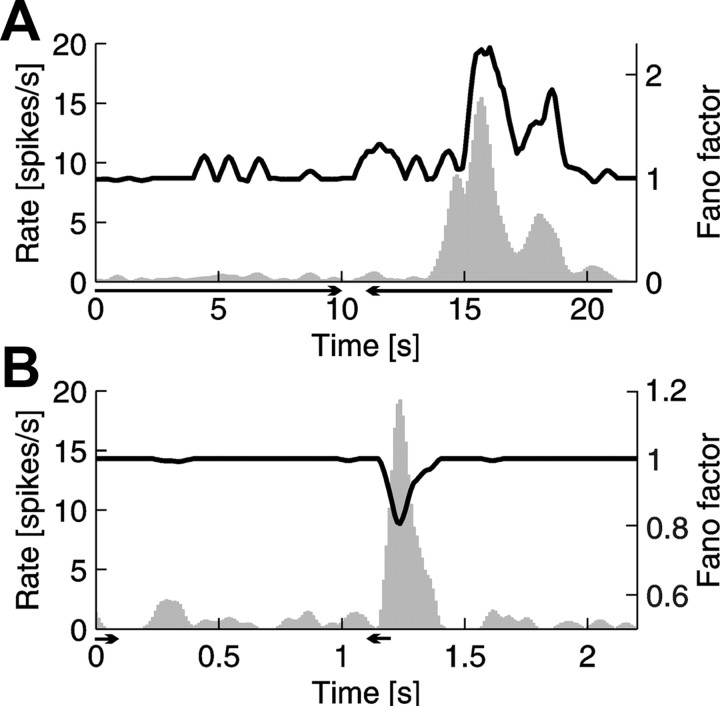
Figure 3.
An example of the relationship between the firing rate and FF for a collicular cell responding in a broad range of stimulus velocities (LVE/HVE cell). Each plot shows the PSTH in the form of gray histogram, with scale given on the left vertical axis. Black lines represent the changing values of the FF with scale given on the right vertical axis. Lengths of the horizontal arrows below the time axis indicate duration of the stimulus, and their heads show the direction of motion. A, Response to low velocity (5°/s) stimulus. During response increase of variability (FF) coincided with an increase of the rate. B, Response to high velocity (500°/s) stimulus. During response, decrease of variability (FF) coincided with an increase of the rate. Notice that, in the case of A and B, peak values of firing rate were similar.

