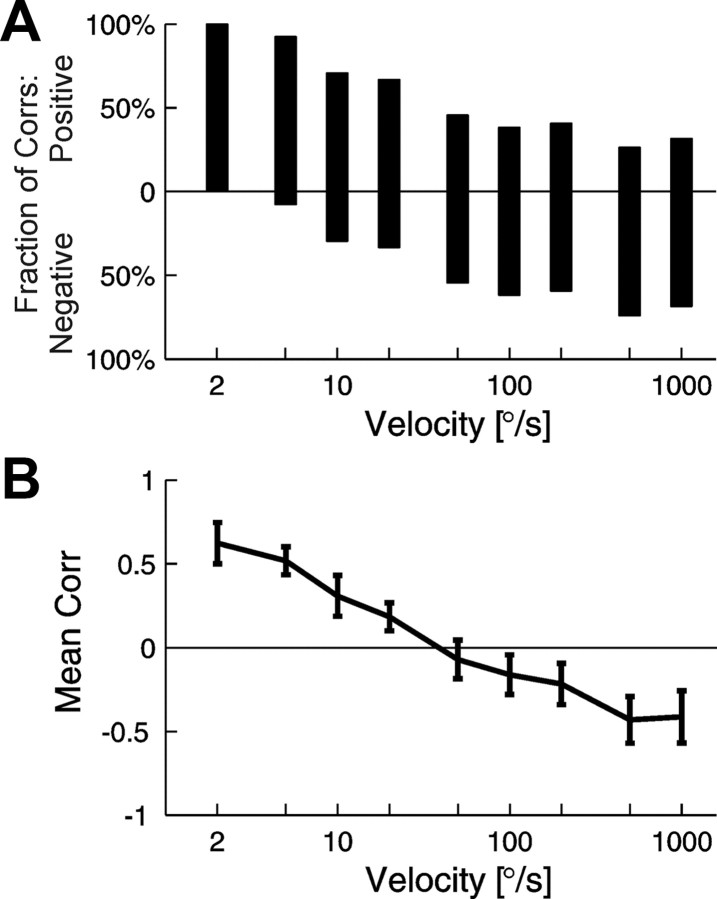
Figure 4.
Correlation coefficient between the firing rate and FF as a function of stimulus velocity. Pearson's correlation coefficients for experimental data were computed only for periods of responses to visual stimulation. A, Fraction of positive (above the 0 baseline) and fraction of negative (below the 0 baseline) correlation coefficients for a given velocity of stimulus for the whole cell population. B, Mean correlation coefficients for particular velocities obtained by averaging over the responses of all cells. Error bars correspond to SEM values. The firing rate and the FF values were computed in 200 bins for each velocity.

