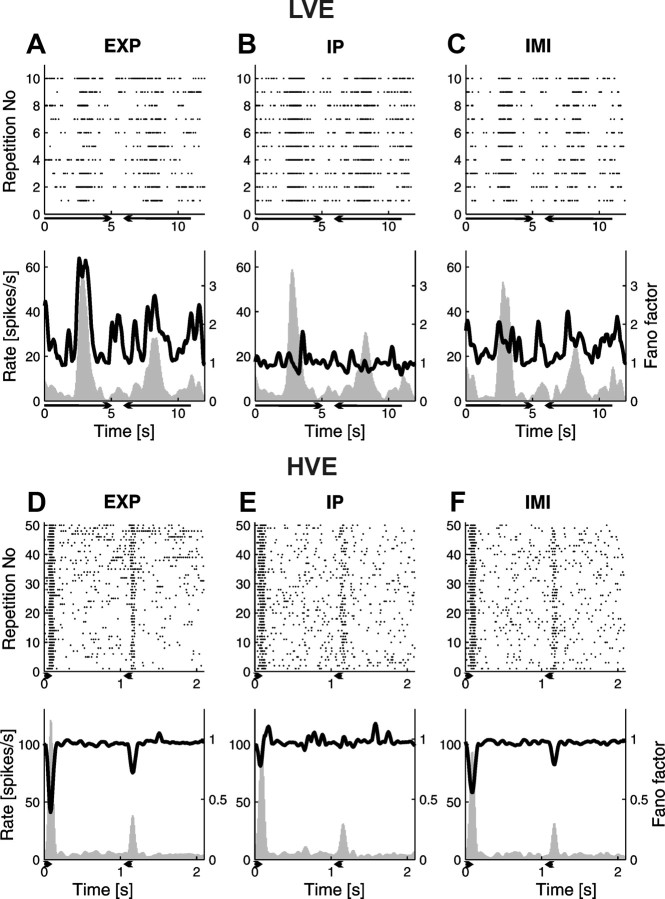
Figure 6.
Comparison of experimental and surrogate data results for two cells: one from the LVE group (A–C) and the second from the HVE group (D–F). In the left column (A, D), experimental data (EXP) are presented. In the middle column (B, E), surrogate data generated with the IP process are presented. In the right column (C, F), surrogate data generated with the IMI process are presented. Each dataset is presented as a raster plot (top) and PSTH (below, gray histogram with scale set on the left vertical axis). The black solid line superimposed on every PSTH is the FF as a function of time (with scale set on the right vertical axis). Lengths of the horizontal arrows below the time axis indicate duration of the stimulus, and their heads show the direction of motion. A, Experimental data. Responses of an LVE cell to slowly moving stimulus (10°/s). Variability of response increases together with the increase of the rate. B, Surrogate data from the IP model. The model was estimated from smoothed experimental firing rate of neuron responses presented in A. In this case, FF oscillates around 1, which is the theoretical value for the Poisson process. Notice that no increase in FF during response can be seen. C, Surrogate data from the IMI model estimated from the responses presented in A. FF in the peak of the response does not reach the value of FF obtained for experimental data. D, Experimental data. Responses of an HVE cell to high velocity (1000°/s) stimulus. Notice that changes in FF are negatively correlated with changes of firing rate during the response. When the rate increases, the variability of response (FF) goes down. E, F, Surrogate data generated with IP and IMI models, respectively. Parameters of models were estimated from responses presented in D. In the case of IP data, FF oscillates around 1, with only slight decrease at peak response, whereas for IMI data, dependency of changes of FF and firing rate replicates experimental results. In all the plots, the number of bins on the time axis was 200.

