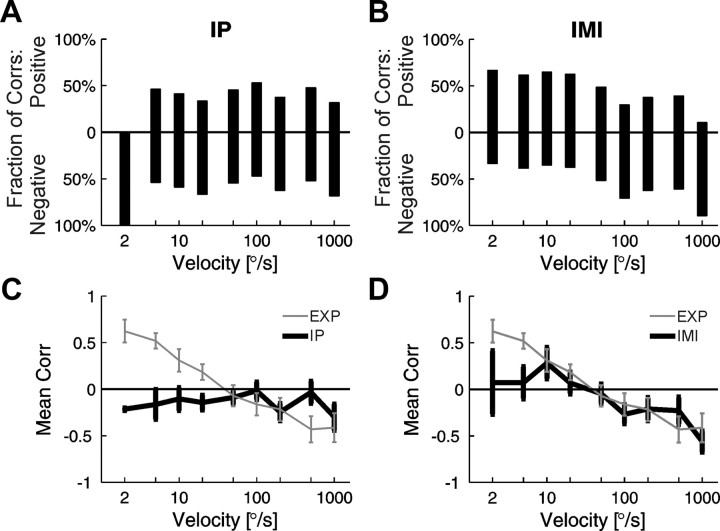
Figure 8.
Velocity dependence of correlations between firing rate and FF for surrogate data for the whole population of cells. Data generated using the IP model are presented in the left column (A, C). Data from the nonparametric IMI model are shown in the right column (B, D). Mean Pearson's correlation coefficients between the firing rate and FF were computed over periods corresponding to the response to visual stimulation in the original experimental data (EXP). A, B, Fraction of positive (above the 0 baseline) and fraction of negative (below the 0 baseline) correlation coefficients for a given velocity in the whole population of cells. C, D, Means of correlation coefficients for a given velocity; error bars correspond to SEM values. Results for surrogate data (for IP and IMI, respectively) are presented in black. For comparison, the experimental results are plotted in gray (compare with Fig. 4).

