
Figure 2.
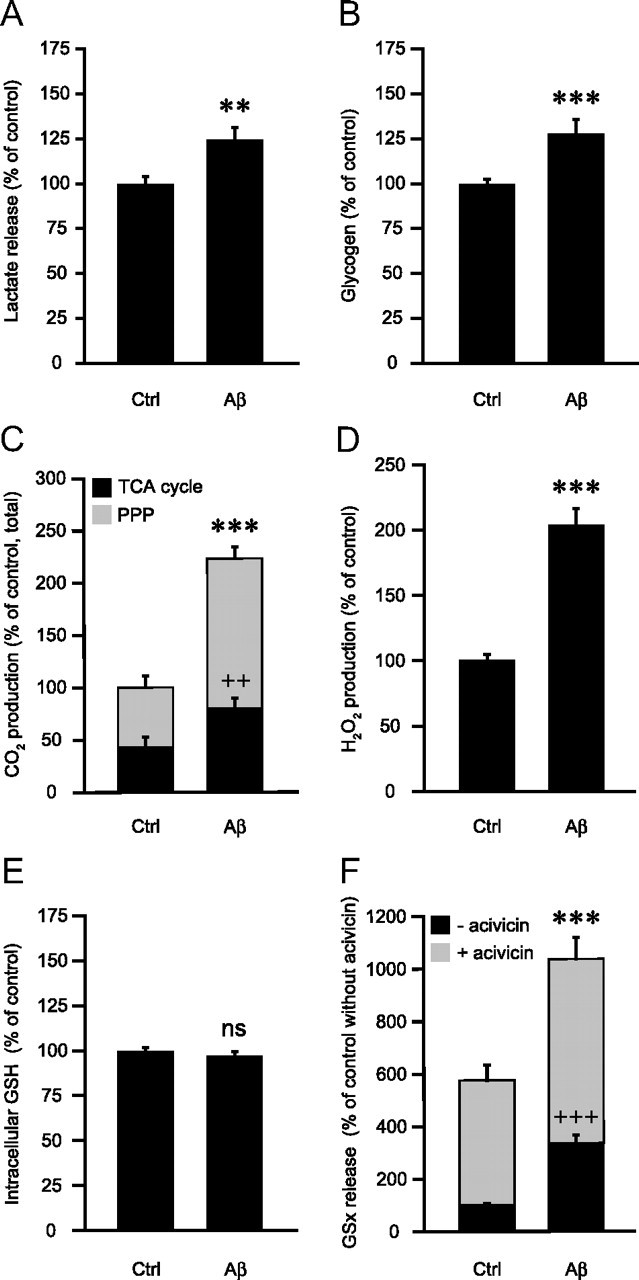
Effects of Aβ on astrocyte metabolism. A–F, Astrocytes were stimulated with 25 μm Aβ25-35 for 48 h and the following metabolic parameters were evaluated: A, Lactate release. Results are expressed as percentage of control (Ctrl) values (140.1 ± 15.2 nmol/dish) and are means ± SEM of at least 23 determinations from at least eight independent experiments. B, Glycogen levels. Results are expressed as percentage of Ctrl values (35.9 ± 2.2 nmol/ dish) and are means ± SEM of at least 12 determinations from at least four independent experiments. C, CO2 production in the PPP and the TCA cycle. Results are expressed as percentage of Ctrl values for the total production of CO2 (0.0302 ± 0.0075 nmol of CO2 per dish per min) and are means ± SEM of at least six determinations from at least three independent experiments. D, Hydrogen peroxide production. Results are expressed as percentage of Ctrl values (0.75 ± 0.08 μm) and are means ± SEM of at least 20 determinations from at least four independent experiments. E, Intracellular glutathione (GSH) content. Results are expressed as percentage of Ctrl values (17.1 ± 1.3 nmol/dish) and are means ± SEM of 12 determinations from four independent experiments. F, Extracellular glutathione (GSx) content. When indicated, the γ-glutamyl-transpeptidase inhibitor acivicin (100 μm) was added 1 h before Aβ25-35 and maintained throughout the whole incubation. Results are expressed as percentage of Ctrl values without acivicin (0.76 ± 0.12 nmol/dish) and are means ± SEM of at least eight determinations from at least three independent experiments. All data were statistically analyzed with t test (** and ++p < 0.01; *** and +++p < 0.001; ns, not significantly different from Ctrl). For C and F, asterisks refer to total CO2 production and acivicin conditions, respectively; cross marks refer to CO2 production in TCA cycle and basal condition (without acivicin), respectively.