Figure 5.
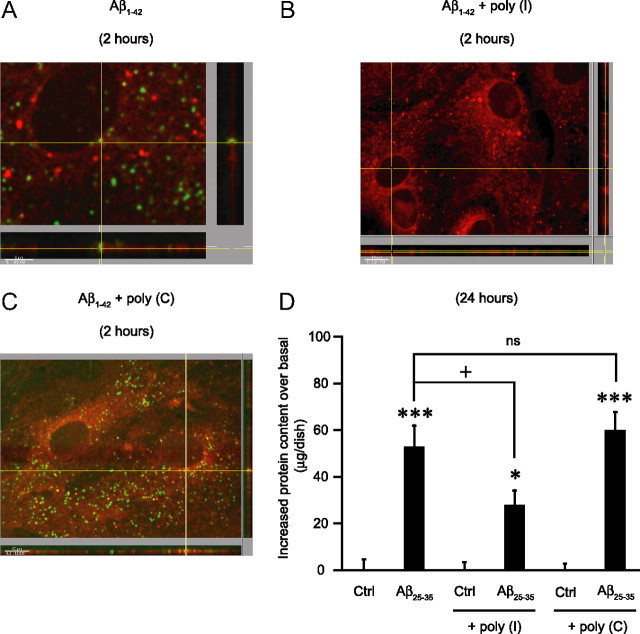
Inhibition of Aβ internalization by the SR-A receptor agonist poly(I). A–D, Astrocyte cultures were exposed to 6 μm FITC-labeled Aβ1-42 for 2 h (A, B, C) or to 25 μm Aβ25-35 for 24 h (D), in the presence or absence of 500 μg/ml poly(I) or poly(C). When indicated, poly(I) and poly(C) were added 1 h before amyloid peptide and maintained during the entire incubation period. A, Internalization of FITC-Aβ1-42 in green demonstrated by confocal microscopy using DiD for cell-membrane-labeling (here in red). B, C, Poly(I) completely inhibited FITC-Aβ1-42 internalization (B), whereas poly(C) was without effect (C). At the bottom and the right of pictures (A, B, C), in an orthogonal view, are cross sections of the x and y axes to the z axis, demonstrating that green dots are inside cells (cell membrane in red). Scales are shown in the lower left corner of the pictures (5 μm for A; 10 μm for B and C). D, Inhibition of protein accumulation. Cell protein content was determined using the BCA assay. Results are expressed as difference in micrograms from the mean protein content of the respective basal conditions [control (Ctrl), poly(I) and poly(C)] and are means ± SEM of at least eight determinations from three independent experiments. Data were statistically analyzed with ANOVA followed by Bonferroni's test [***p < 0.001 vs respective basal conditions, Ctrl and poly(C); *p < 0.05 vs poly(I); +p < 0.05 vs Aβ25-35; ns, not significantly different from Aβ25-35]. In this set of experiments the mean protein content in basal conditions were as follows: 109.0 ± 7.7 μg/dish (Ctrl), 81.7 ± 5.4 μg/dish [poly(I)], and 85.0 ± 11.7 μg/dish [poly(C)].

