
Figure 2.
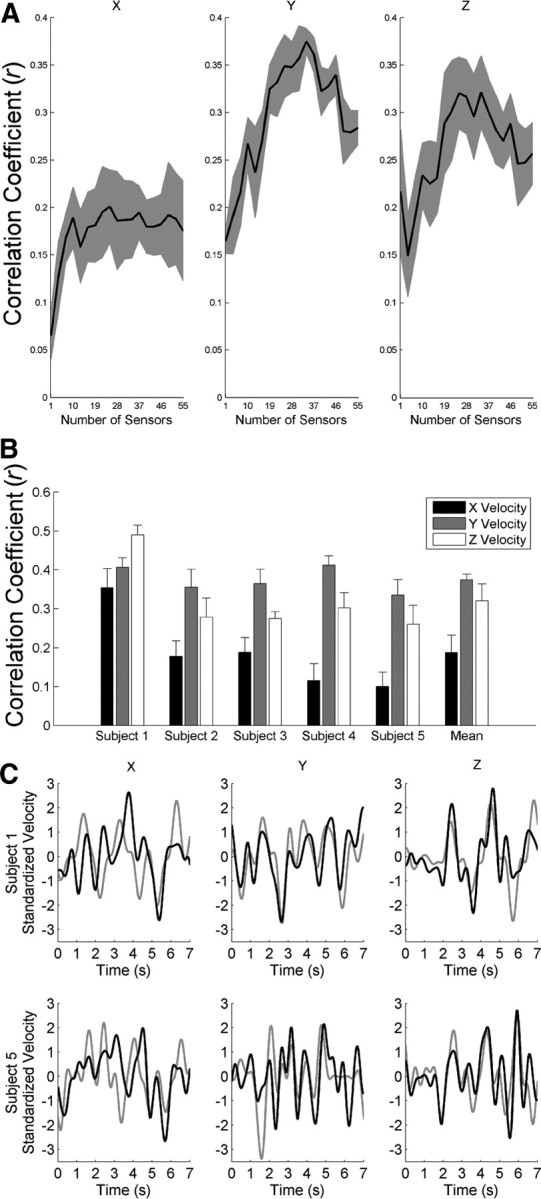
EEG decoding accuracy of hand velocity. A, The mean (black) ± SEM (gray) of the r values across subjects (n = 5) versus the number of sensors exhibited a peak at 34 sensors. B, With 34 sensors, we computed the mean ± SEM of the r values across cross-validation folds (n = 8) for each subject for x (black), y (gray), and z (white) velocities. C, Reconstructed (black) and measured (gray) velocity profiles demonstrated similarities. Exemplar velocity profiles from the subjects with the best (subject 1, top row) and worst (subject 5, bottom row) decoding accuracies are shown.