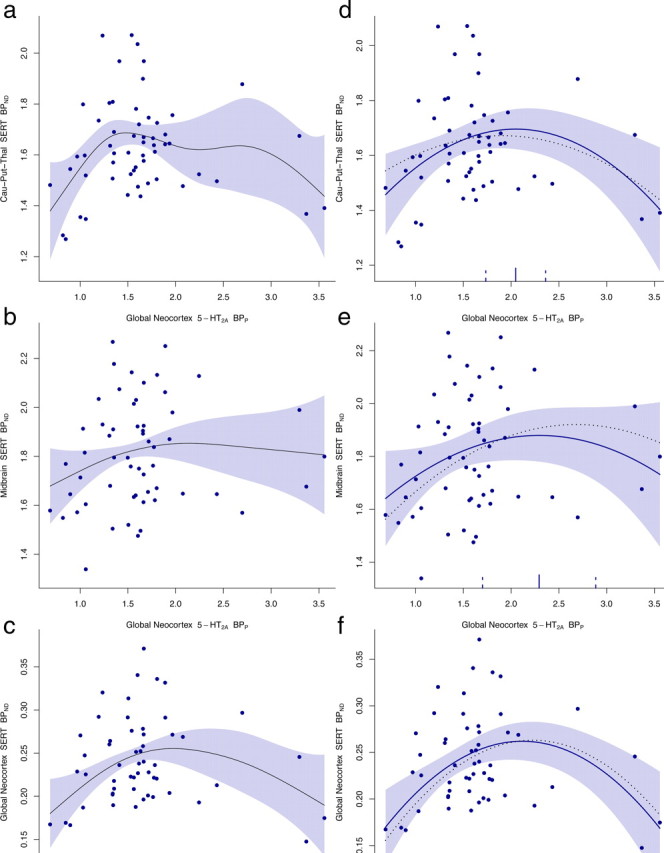
Figure 2.

Left, The estimated regression functions from nonparametric analyses with approximate 95% pointwise confidence limits, in caudate–putamen–thalamus (a), midbrain (b), and neocortex (c). Right, Estimated quadratic relationship between neocortical 5-HT2A receptor BPP (x-axis) and SERT BPND (y-axis) with pointwise 95% confidence limits in caudate–putamen–thalamus (d), midbrain (e), and neocortex (f), respectively. A subsample of individuals with a maximum 2 week interval between the two measurements is represented with a dotted line. The estimated top points of the quadratic curves (d–f) with approximate 95% confidence limits are shown on the x-axis.
