
Figure 4.
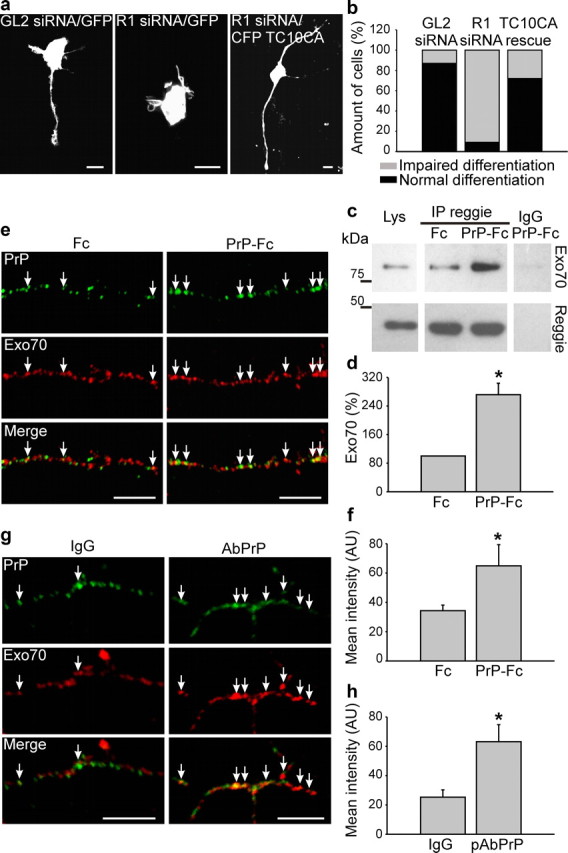
PrP-Fc-induced signaling affects TC10 and Exo70 interaction with reggie. a, b, Neurons were transfected with control (GL2) siRNA, reggie-1 siRNA, or simultaneously transfected with reggie-1 siRNA and CA TC10, respectively. The reggie-1 siRNA phenotype was rescued in 60% of the neurons. Scale bar, 10 μm. c, d, Reggie immunoprecipitates from HPL3-4 cells transfected with wt PrP and incubated live with Fc or PrP-Fc were probed with Abs against Exo70 and reggie. Immunoprecipitation with nonspecific IgG was used as control. The level of Exo70 is increased in reggie immunoprecipitates from PrP-Fc-stimulated cells. Histograms show the quantification of the blots with OD for Fc stimulation set to 100%. Mean values ± SEM are shown (n > 6). *Statistical significance, p ≤ 0.05, paired Student's t test. e, Live neurons, treated with Fc or with PrP-Fc, and labeled with Abs against Exo70 show twice as many coclusters between Exo70 and PrP after exposure to PrP-Fc as opposed to Fc (arrows). Scale bar, 10 μm. f, The histogram shows mean labeling intensity of Exo70 in PrP clusters. Mean values ± SEM (n > 50 neurons) are shown. *Statistical significance, p ≤ 0.05, paired Student's t test. g, Wt hippocampal neurons incubated live with PrP Abs to activate PrP show an increased colocalization of PrP and Exo70 (arrows). Scale bars, 10 μm. h, Histogram shows mean labeling intensity of Exo70 in PrP clusters. Mean values ±SEM (n > 50 neurons) are shown in arbitrary units (AU). *Statistical significance, p ≤ 0.05, paired Student's t test.