
Figure 6.
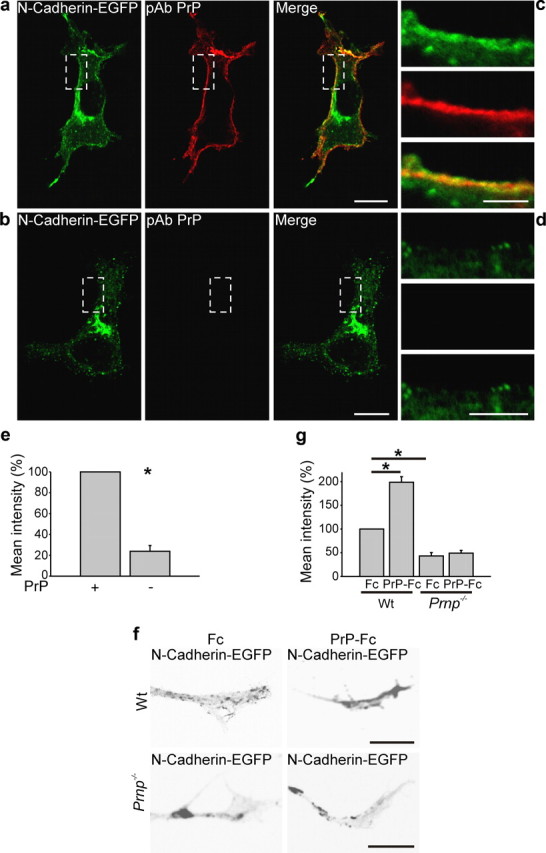
PrP regulates the delivery of N-cadherin to the plasma membrane. a, b, PrP-deficient HPL3-4 cells were transfected with PrP and N-cadherin-EGFP and the level of N-cadherin at the plasma membrane was compared with cells cotransfected with N-cadherin-EGFP and empty vector as control. Immunofluorescence and the corresponding histograms show that the mean intensity of N-cadherin-EGFP at the plasma membrane is four times lower in PrP-deficient cells compared with PrP-transfected cells. The boxed region in a is enlarged in c, and that of b in d. Scale bar: a, b, 20 μm; magnified regions, 10 μm. e, The histogram shows mean intensity of N-cadherin-EGFP. Mean values ± SEM (n > 100) are shown. *Statistical significance, p ≤ 0.05, paired Student's t test. f, Wt and PrP−/− neurons were transfected with N-cadherin-EGFP and treated with Fc or PrP-Fc. Note that PrP-Fc increased the level of N-cadherin at the periphery of the growth cones in wt but not in PrP−/− hippocampal neurons. g, The histogram shows mean intensity of N-cadherin-EGFP. Mean values ± SEM (n > 100 neurons) are shown. *Statistical significance, p ≤ 0.05, one-way ANOVA test.