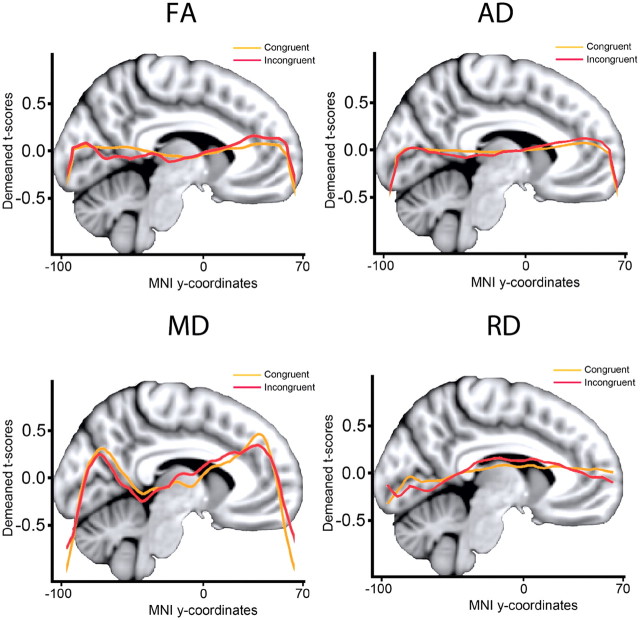
Figure 5.
Posterior-to-anterior effects. Mean t value in the skeleton at each integer MNI y-coordinate was calculated and fitted by locally weighted scatterplot smoothing. As can be seen from the locally weighted scatterplot smoothing curves, the effects are relatively similarly distributed in the posterior and anterior parts of the brain, and no clear difference in the posterior to anterior gradient can be seen between conditions.

