
Figure 1.
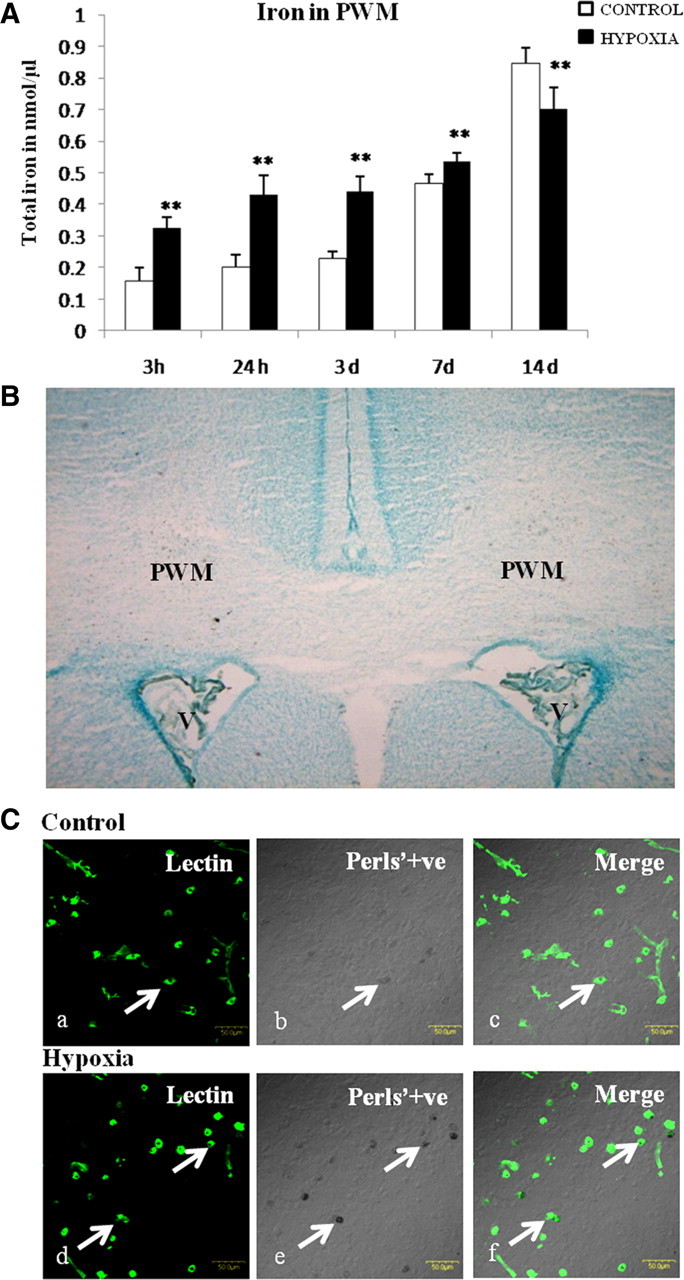
A, Iron content in the PWM of postnatal rats at 3 and 24 h, 3, 7, and 14 d after hypoxic exposure and their corresponding controls. Significant differences in total iron level between hypoxic and control groups are expressed as **p < 0.01. B, Light-microscopic image of a brain section stained with Perls' solution and methyl green, showing the region of interest, PWM just peripheral to the lateral ventricles (V). C, Confocal images of Perls' iron-stained sections showing iron localization in the PWM at 3 d after hypoxic exposure and their corresponding controls. Distribution of lectin (marker for microglia) (Ca, Cd; green) and iron localization (Cb, Ce; black) is seen in AMCs (arrows) in the PWM in overlays Cc and Cf (merge). Scale bars, 50 μm. The experiments were performed in triplicate.