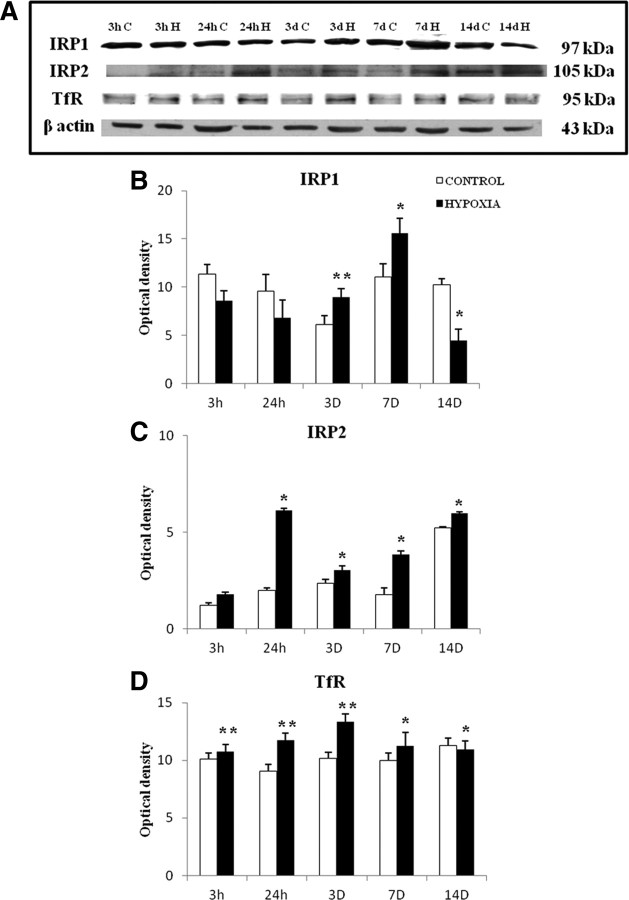
Figure 2.
Western blot showing the protein expression of IRP1, IRP2, and TfR in the PWM of postnatal rats at 3 and 24 h, 3, 7, and 14 d after hypoxic exposure and their corresponding controls. A shows the immunoreactive bands of IRP1 (97 kDa), IRP2 (105 kDa), TfR (95 kDa), and β-actin (43 kDa). B–D are their corresponding bar graphs showing significant changes in the optical density following hypoxic exposure (given as mean ± SD). The experiment was repeated five times, and a representative blot is shown here. Significant differences in protein levels between hypoxic and control groups are expressed as follows: *p < 0.05; **p < 0.01.

