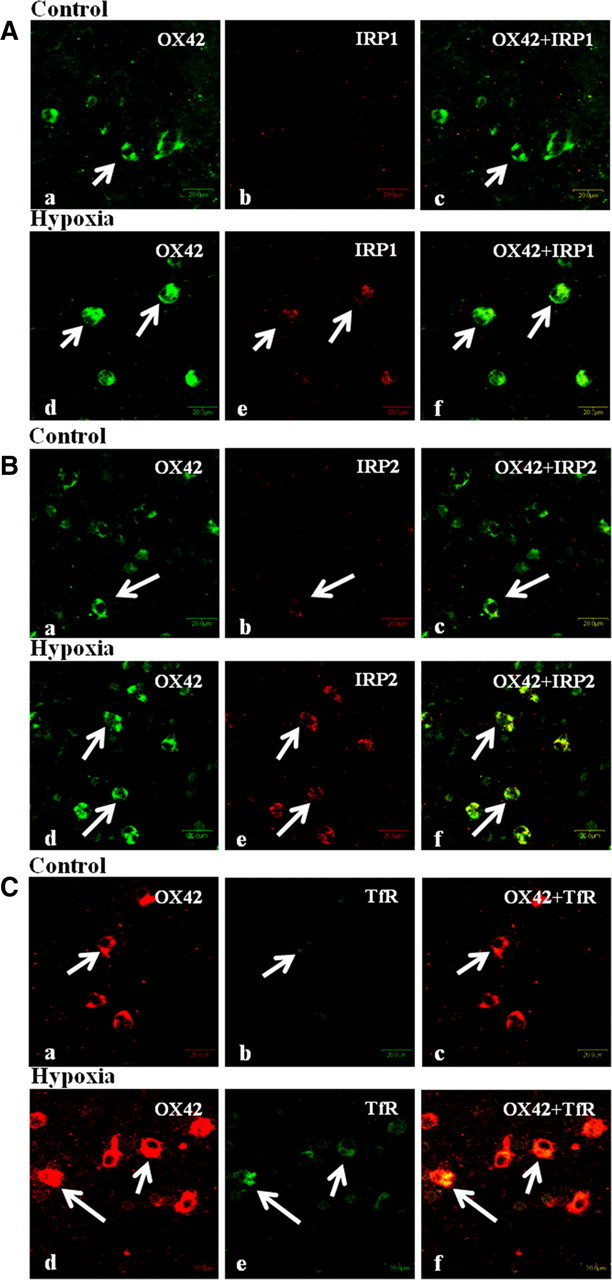
Figure 3.

Confocal images showing the expression of OX42, IRP1, IRP2, and TfR in the PWM at 3 d after hypoxic exposure (Ad–f, Bd–f, Cd–f) and their corresponding control (Aa–c, Ba–c, Ca–c). Expression of OX42 (A, Ba,d: green; Ca,d: red), IRP1 (Ab,e: red), IRP2 (Bb,e: red), TfR (Cb,e: green), and a colocalization of OX42 with IRP1, IRP2, and TfR (A–Cc,f). Scale bars: A–C, 20 μm. The experiment was repeated five times.
