
Figure 4.
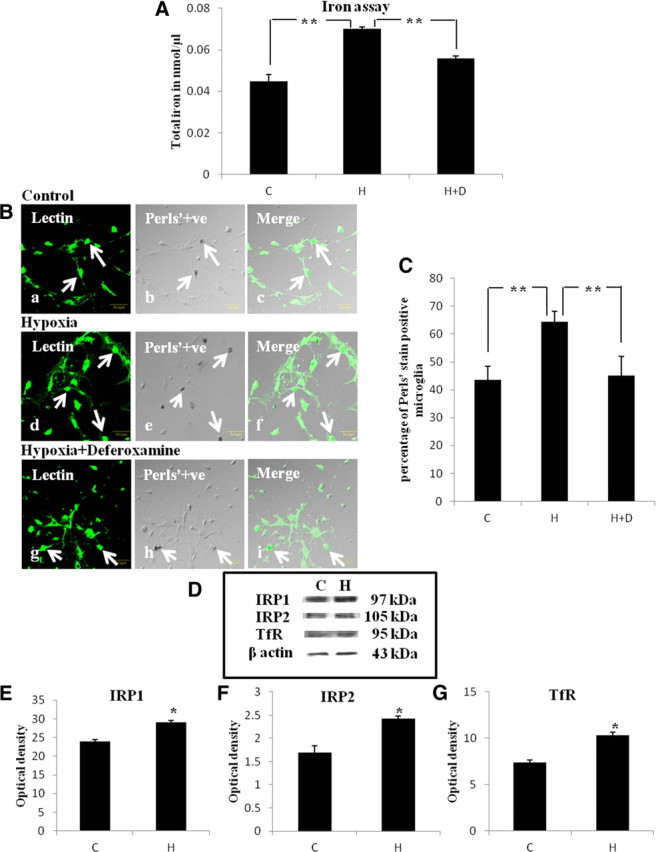
A, Bar graph in A shows significant changes in the total iron content in microglial culture. Note the reduction of iron in hypoxic microglial cells when treated with deferoxamine (H+D). Significant differences in total iron level between control (C), hypoxic (H), and deferoxamine treated groups are expressed as follows: *p < 0.05; **p < 0.01. B, Confocal images of Perls' iron-stained primary microglial cells in control, hypoxic, and deferoxamine (Hyp+Def)-treated hypoxic microglia. Distribution of lectin (a, d, g: green) and iron localization (b, e, h: black) is seen in microglia (arrows). Scale bars, 50 μm. C, Bar graph in C shows the significant changes in the percentage of microglia that are Perls' positive. Significant differences between the groups are expressed as follows: *p < 0.05; **p < 0.01. The experiment was repeated in triplicate. D, Western blot showing the protein expression of IRP1, IRP2, and TfR in the primary microglial culture. E–G are their corresponding bar graphs showing significant changes in the optical density between control (C) and hypoxia (H) (given as mean ± SD). Significant differences in protein levels between hypoxic and control groups are expressed as follows: *p < 0.05; **p < 0.01. The experiment was repeated five times.