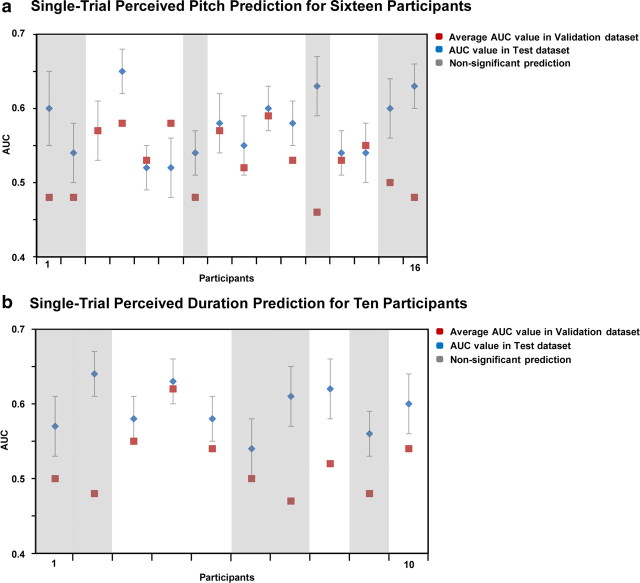
Figure 2.
Single-trial EEG classification results for the pitch-discrimination experiment (Expt. 2a) and for the duration-discrimination experiment (Expt. 2b). Blue dots, Average values of the AUC across 10 splits of the data for each of the 16 (pitch experiment) or 10 participants (duration; ±SEM across the 10 splits); red dots, AUC values on a validation dataset for each participant. The validation AUC values provide an objective measure of our algorithm's performance on completely new trials. Masked values (gray) indicate AUC values on the validation dataset that did not differ from chance level (participants 1, 2, 7, 12, 15, 16 for the pitch and participants 1, 2, 6, 7, 9 for the duration experiments).

