
Figure 3.
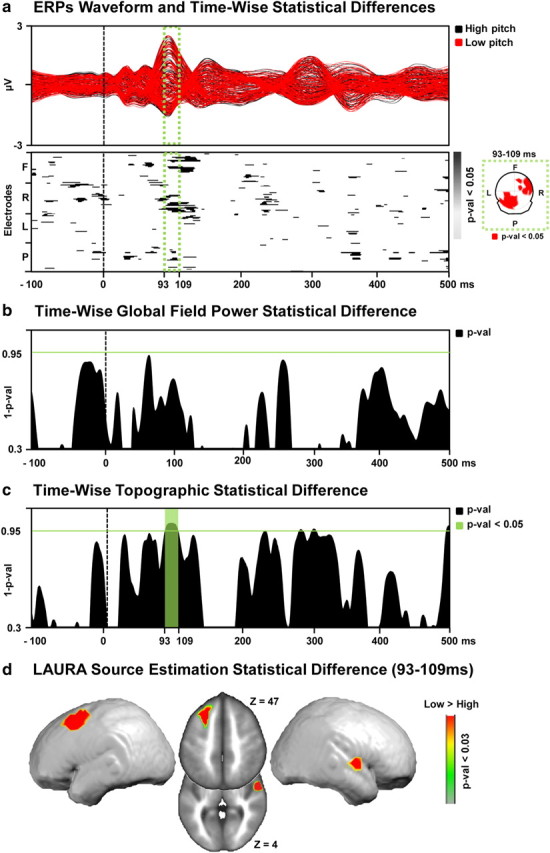
a, Top, The ERP to the low (red) and high (black) perceived pitch conditions are displayed in microvolts as a function of time relative to sound onset. The time period showing significant (p < 0.05) topographic difference between the conditions is indicated in green. Bottom, The results of the timewise paired t tests at each of the scalp electrodes from the group-averaged ERP waveforms are shown (only p < 0.05 with an 11 time-frame temporal criterion are shown). In the green box, the scalp topography of the significant differences for the 93–109 ms period after stimulus onset represented nasion upward. b, Results of the timewise paired t tests on the global field power contrasting “high” versus “low” perceived pitch conditions. Period of significant (p < 0.05; 11 time-frame temporal criterion) differences in response strength are marked in green. c, Results of the timewise analysis of the global dissimilarity contrasting “high” versus “low” perceived pitch conditions. Period of significant (p < 0.05; 11 time-frame temporal criterion) topographic differences are marked in green. d, Distributed LAURA source estimations. Statistical contrast (paired t test) across all solution points during the period of topographic modulation (93–109 ms after stimulus onset) reveals a significantly stronger (p < 0.03) activation of the left middle frontal gyrus and right superior temporal gyrus in the “low” versus “high” perceived pitch condition.