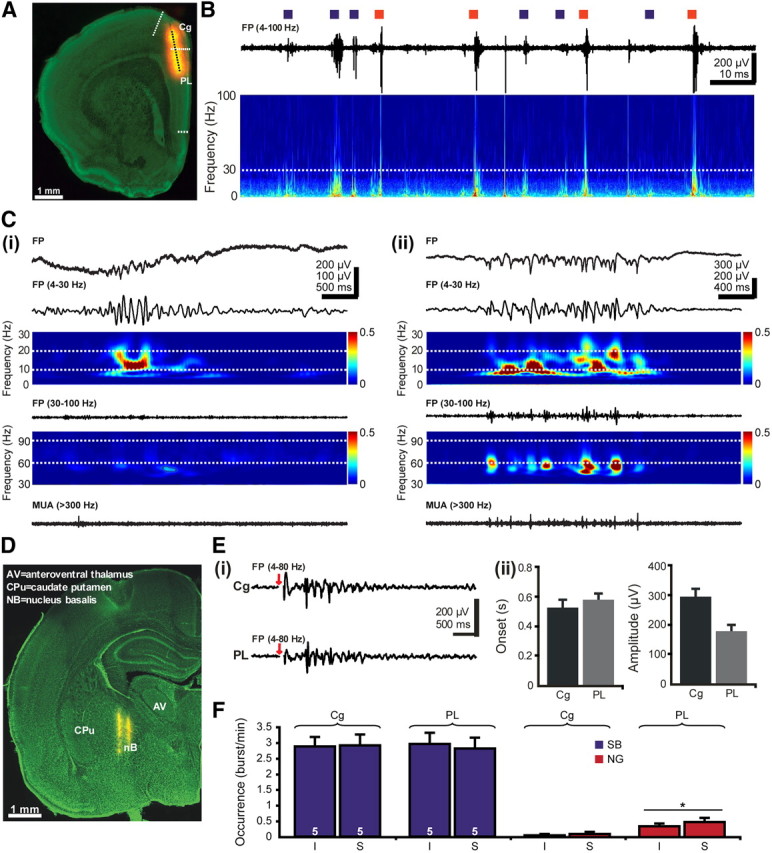
Figure 2.

Effects of cholinergic activation on the patterns of network activity in the neonatal PFC. A, Digital photomontage reconstructing the location of the DiI-covered recording electrode (orange) in the PFC of a Nissl-stained 50-μm-thick coronal section (green) from a P7 rat. Blue dots mark the 16 recording sites covering the cingulate and the prelimbic areas of the PFC. B, Extracellular FP recording of the intermittent oscillatory activity in the PFC of a P7 rat. Blue squares mark the SB, whereas red squares correspond to NG. The trace is accompanied by the “whitened” spectrogram of FP at identical timescale. The white dotted line marks the lower border of gamma frequency band (30 Hz). Note the wider frequency distribution for NG than for SB. Ci, Characteristic SB displayed before (top) and after bandpass (4–30 and 30–100 Hz) filtering (middle) and the corresponding MUA after 300 Hz high-pass filtering. Note the low spike discharge during SB. Color-coded frequency plots shows the wavelet spectrum of the FP with a mean frequency in alpha band and without detectable gamma activity. Cii, Characteristic NG displayed before (top) and after bandpass (4–30 and 30–100 Hz) filtering (middle) and the corresponding MUA after 300 Hz high-pass filtering. Note the presence of prominent gamma episodes that are accompanied by spike discharge. The top color-coded wavelet spectrum reveals the main frequency of NG within the theta–alpha band, whereas the NG episodes appear as periodic high-power spots on the bottom wavelet. D, Digital photomontage reconstructing the location of DiI-covered bipolar stimulation electrode (yellow) in a 100-μm-thick Nissl-stained coronal section, including the nB. Ei, Examples of SB elicited in the Cg and PL by single electrical stimulation of the nB. Red arrows mark the electrical stimulus. Stimulus artifacts were removed. Eii, Properties of SB evoked in the Cg and PL after single stimulation of the nB. Bar diagrams depict the similar onset (left) and the significantly (p < 0.05) different amplitude (right) of evoked oscillations in the two prefrontal areas. F, Bar diagram displaying the occurrence of SB and NG in the Cg and PL of five P7–P8 pups after electrode insertion (I) and tetanic stimulation of the nB (S).
