
Figure 3.
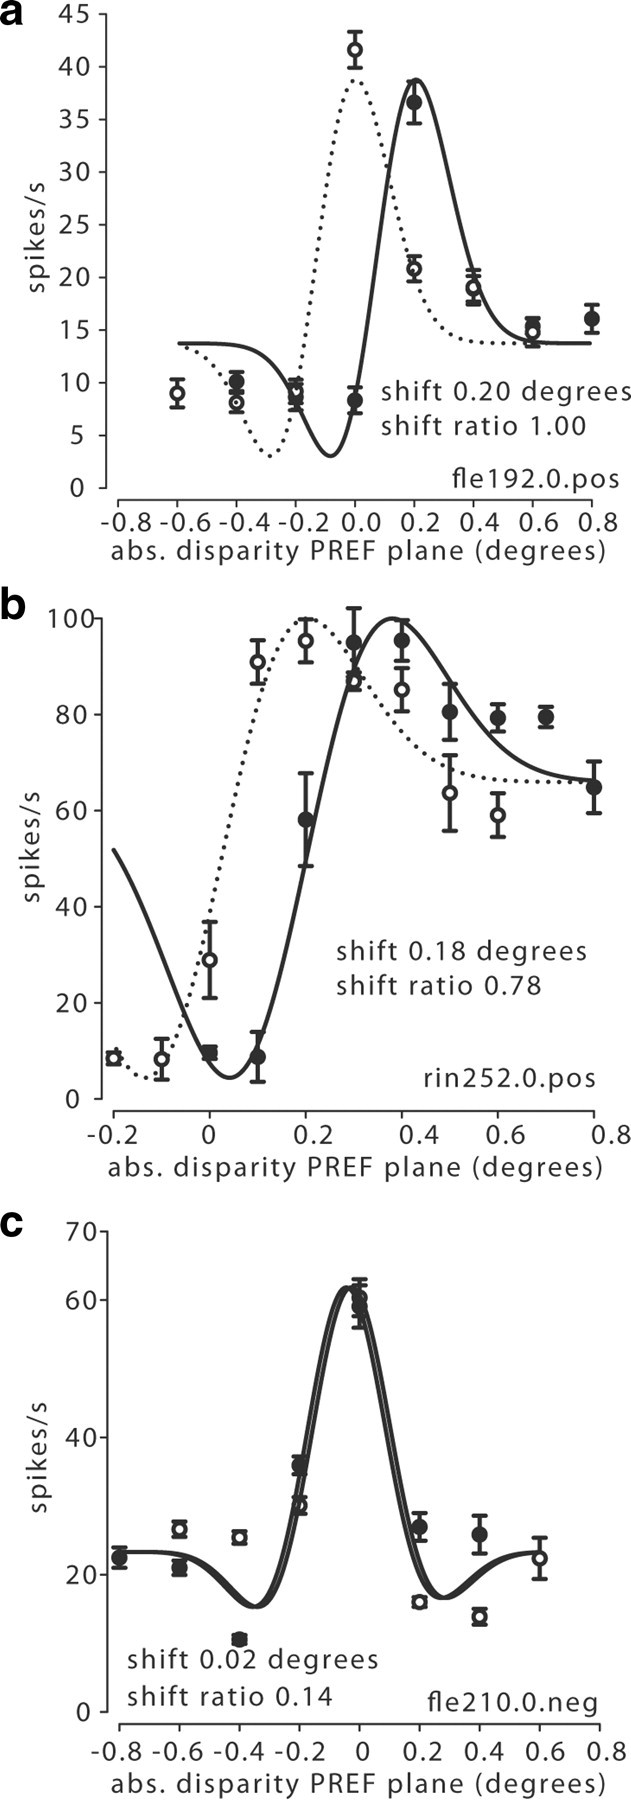
Calculation of shifts. a, A pair of tuning curves from Figure 2a collected with a zero pedestal and at a positive (pos) pedestal disparity of 0.2° were fitted with Gabor functions. The two functions were only allowed to differ in their horizontal offset, called the ‘shift’, measured in degrees (abs., absolute). The shift ratio (after vergence correction) was 1.00, indicating relative disparity selectivity. b, This pair of tuning curves from Figure 2d was recorded with a zero pedestal and a positive pedestal of 0.2°. The shift ratio was 0.78 (after vergence correction). c, When similarly fitted with a pair of Gabor functions, the example cell from Figure 2g had a very small shift between the tuning curves for the negative (neg) near pedestal (−0.2°) and the zero pedestal. The shift ratio (after vergence correction) for this cell was 0.14, which indicates absolute disparity selectivity.