
FIGURE 5.
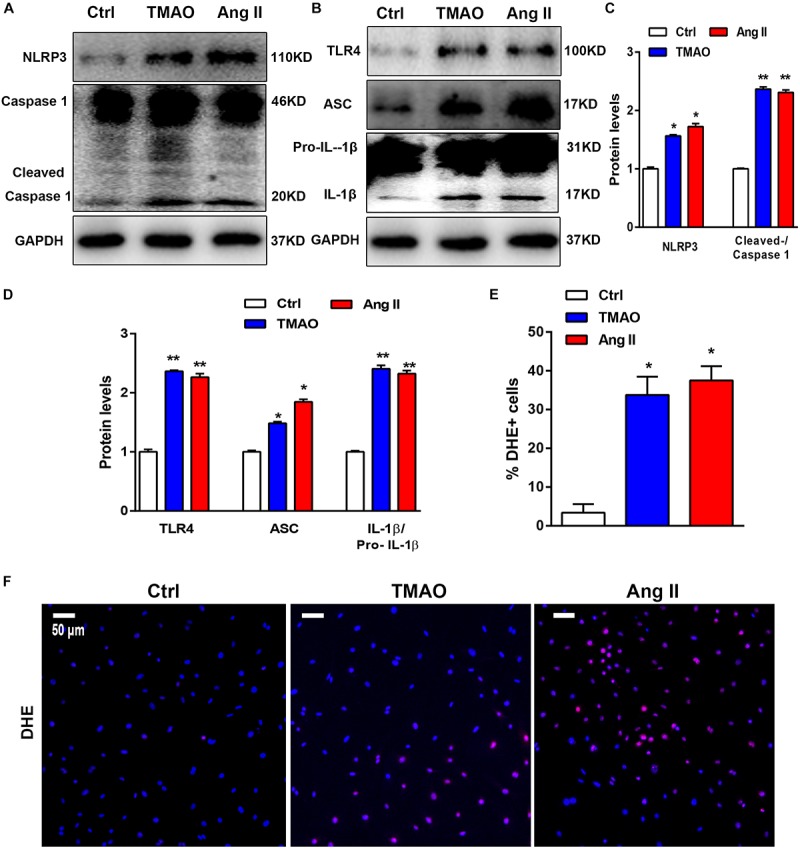
TMAO induced NLRP3 inflammasome activation in vitro. (A,B) NLRP3, pro-IL-1β,IL-1β, caspase-1, cleaved caspase-1, TLR4, and ASC protein expression levels were analyzed by western blotting and quantified (C,D) according to immunoblotting (the ratio of protein pixel density/GAPDH pixel density) after TMAO or Ang II treatment for 24 h. (E,F) Representative images and quantification of DHE staining (red) and DAPI (blue). Scale bar = 50 μm. All data were analyzed at least three times. Mean ± SD. ∗P < 0.05, ∗∗P < 0.01, ∗∗∗P < 0.001 (vs. Control).