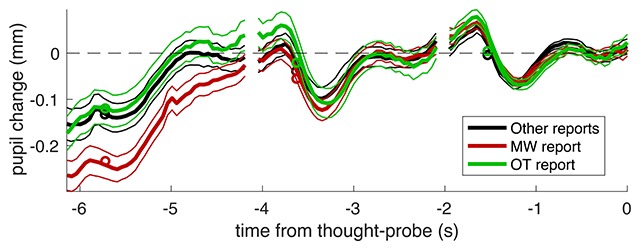
Figure 3.

Pupil traces aligned to the average pupil diameter during the last trial before the thought-probe. Thick lines give the average across all trials, thin lines show the s.e. and circles show the average values entered the LMM analysis (average over the first half of each trial).
