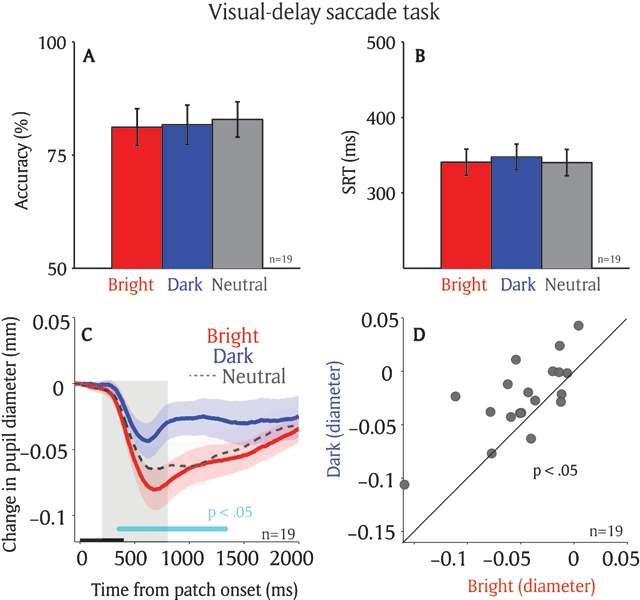
Figure 2.

Effect of saccade planning on the local luminance modulation. Saccadic behaviors on different patch conditions on the visual-delay task (n = 19) (A) Saccade accuracy. (B) Saccade reaction times. (C) Change in pupil diameter following the presentation of patch stimuli in different conditions. (D) Pupil size in diameter (200 to 800 ms) between bright and dark patch conditions for each individual participant. In A, B, the error-bars represent ± standard error across participants. In C, the shaded colored regions surrounding the pupillary response represent ± standard error range (across participants) for different conditions. The black bar on X-axis indicates the time line of patch presentation, and the cyan bar on X-axis indicates the time line at which differences between the bright and dark conditions were statistically significant (p < 0.05). The 200–800 ms epoch after the patch onset is shaded in gray. n: number of participants. SRT: saccade reaction times.
