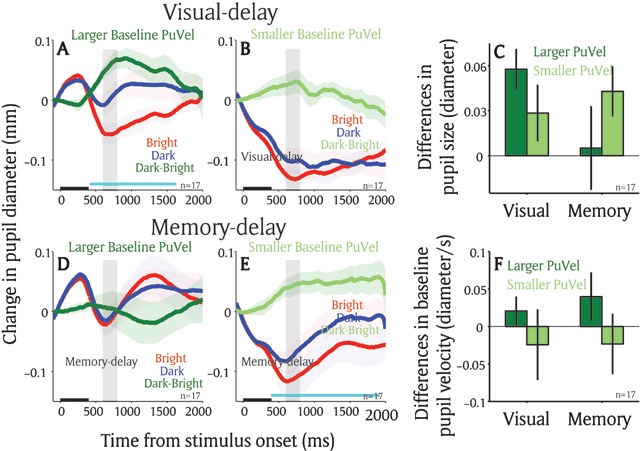
Figure 5.

Arousal effect on the local luminance modulation between two tasks. Change in pupil diameter following the presentation of patch stimuli in different conditions in the visual-delay saccade task (n = 17) in larger baseline (–50 to 0 ms) pupil velocity (A), or smaller baseline pupil velocity (B). Change in pupil diameter following the presentation of patch stimuli in different conditions in the memory-delay saccade task (n = 17) in larger baseline (–50 to 0 ms) pupil velocity (D), or smaller baseline pupil velocity (E). (C) Pupil size in diameter (600 to 800 ms) between bright and dark patch conditions as a function of task (visual-delay and memory-delay) and baseline pupil velocity (larger and smaller). (F) Baseline pupil velocity (–50 to 0 ms) between bright and dark patch conditions as a function of task (visual-delay and memory-delay) and baseline pupil velocity (larger and smaller). In A, B, D, E, the shaded colored regions surrounding the pupillary response represent ± standard error range (across participants) for different conditions. The black bar on X-axis indicates the time line of patch presentation, and the cyan bar on X-axis indicates the time line at which differences between the bright and dark conditions were statistically significant (p < 0.05). n: number of participants. Difference: differences between the bright and dark conditions. PuVel: pupil velocity. Visual: visual-delay task. Memory: memory-delay task.
