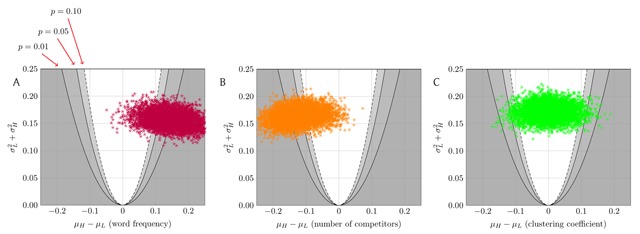
Figure 3.

The result of 5000 runs of our ILP, with k = 50 words per subset, δ = 0.05 tolerance for control variables, and ρ = 0.5 (dichotomizing on the median). Each point in each panel corresponds to a single run of the ILP to select sets A and B; the point plots the difference in mean recognition accuracy between A and B, vs. the sum of the variances of the recognition accuracies in A and B. The parabolas correspond to significance levels in a t-test on A vs. B. (A) The effect of frequency on recognition; 72.6% of these runs show that higher frequency is associated (p < 0.05) with more accurate recognition. (B) The effect of number of competitors; 53.8% of these runs show that having more competitors is associated (p < 0.05) with less accurate recognition. (C) The effect of clustering coefficient; 2.1% of these runs show an effect of clustering coefficient on recognition (p < 0.05), split between showing positive and negative effects. All experiments were controlled as in Figure 1. (See Figure S1 for the variant of this analysis that tests the effect of each variable while controlling for the other two.)
