Figure 5.

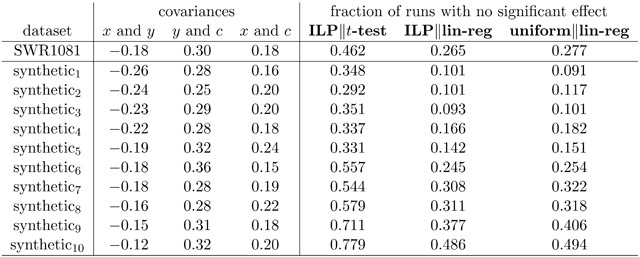
Analysis of SWR1081 and ten synthetic datasets generated to have (approximately) the same covariance matrix. The ten synthetic datasets are sorted in decreasing order of the strength of the relationship between x and y.

Analysis of SWR1081 and ten synthetic datasets generated to have (approximately) the same covariance matrix. The ten synthetic datasets are sorted in decreasing order of the strength of the relationship between x and y.