
Figure 7.
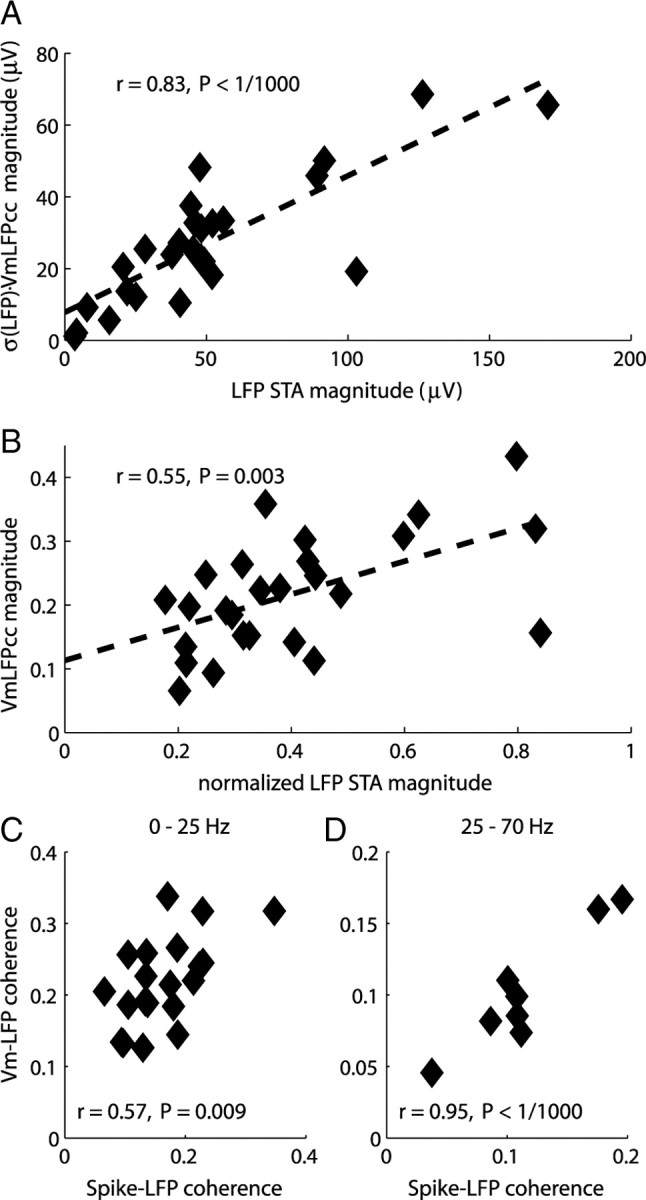
LFP STA and VmLFPcc are correlated in magnitude. A, The magnitudes of VmLPFcc scaled by LFP SD and of LFP STA, both quantified by the value of their absolute peak, are significantly correlated. The dashed line shows the linear regression (y = 0.38x + 7.8). B, The magnitudes of VmLPFcc and of normalized LFP STA, quantified by the value of their absolute peak, are significantly correlated. The dashed line shows the linear regression (y = 0.26x + 0.11). The reduction in the correlation between the two measures (compared to A) is expected, as in A both coordinates are multiplied by LFP SD. C, D, The Vm-LFP and spike-LFP coherences are correlated, both in the low (C) and gamma (D) frequency bands. Only neurons in which both the Vm-LFP and spike-LFP coherences were significant in more than half of the frequency band (see Materials and Methods) were included. Including all the neurons would have further increased the correlation.