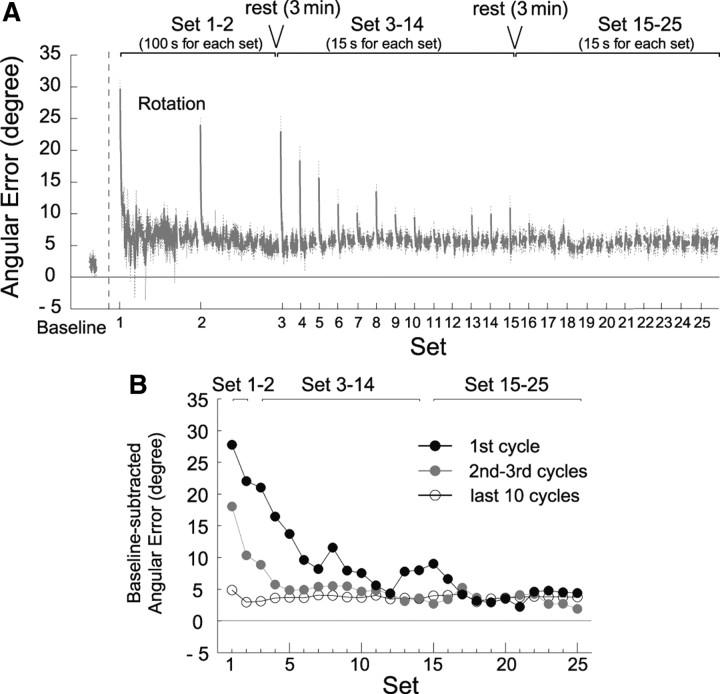
Figure 3.
Angular errors change with the repetition of rhythmic cycles. A, The errors of the first 150 and the last 50 cycles in sets 1–2 and the errors of the first 20 and the last 20 cycles in sets 3–25. The data were averaged across all participants and the dash lines represent ±1 SE. B, The angular errors for the first rhythmic cycle (black circle), the errors averaged across the second and third cycles (gray circle), and those across the last 10 cycles (open circle) as a function of the rhythmic movement set. The data represent the residual errors after subtracting the baseline error. Significant differences between the first cycle and the last 10 cycles and between the second and third and the last 10 cycles were found until the 15th (except for the 10th, 11th, and the 12th set) and third sets, respectively.

