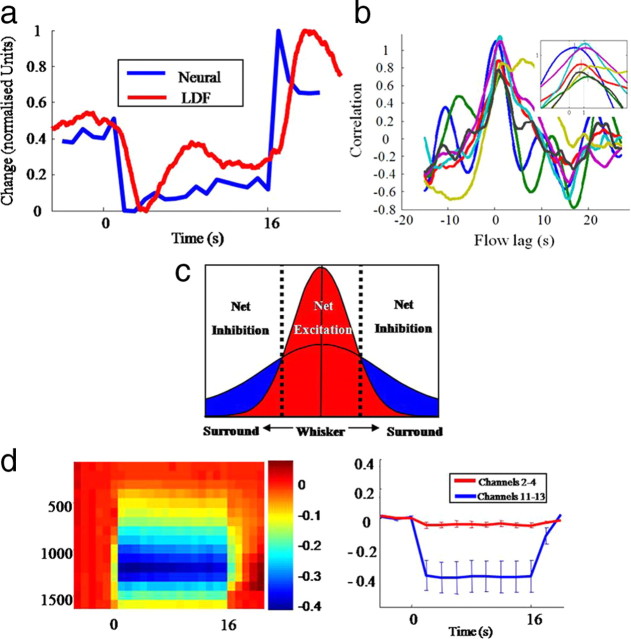
Figure 8.
Simultaneous neural activation and cerebral blood flow (CBF) in surround region. a, Normalized plot of CBF and 500–3000 Hz power time series from channels 11–13 from the surround region. b, Cross-correlation analysis of individual animals at the onset of flow and neural decrease. c, Schematic model to explain net excitation and inhibition effects in whisker and surround regions. d, Left image: 500–3000 Hz power analysis in the whisker region with the first 20 ms after each stimulus impulse removed. Right image: average time series taken through shallow (2:4) and deep (11–13) electrode channels.

