
Figure 2.
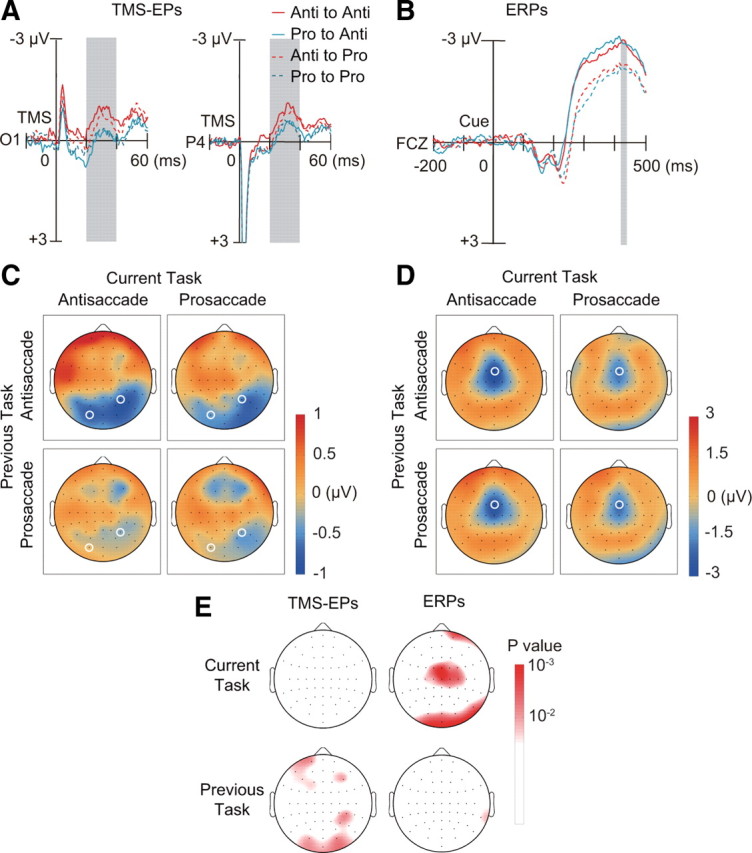
Dissociation between TMS-EPs and ERPs. A, TMS-EPs at electrode O1 and P4 (marked with white circle in C), separately shown for the four conditions based on the previous tasks (red: antisaccade; cyan: prosaccade) and current tasks (continuous line: antisaccade; dotted line: prosaccade). B, ERPs on no-TMS trials at electrode FCZ (marked with white circle in D). Convention same as in A. C, Scalp topography of TMS-EPs amplitude within the time window of 20–40 ms after TMS (gray shading in A), separately shown for previous task (rows) and current task (columns). Amplitudes were linearly interpolated across electrode positions and color-coded according to the color bar on the right. D, Scalp topography of ERPs amplitude within the time window of 420–440 ms after the cue onset (gray shading in B), which corresponds to 20–40 ms after TMS on TMS trials. E, Scalp topography of p values based on two-way ANOVA with factors of current task (upper row) and previous task (lower row). Results are shown separately for TMS-EPs (left column) and ERPs (right column). The p values are linearly interpolated across electrode positions and color-coded according to the color bar shown on the right.