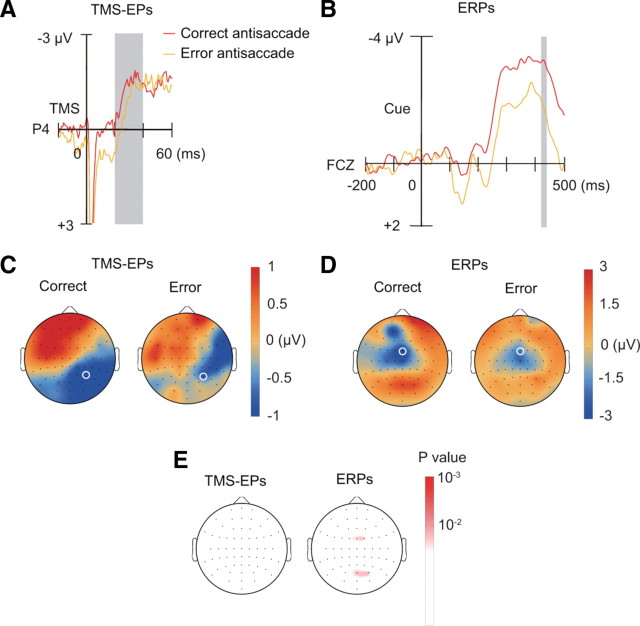
Figure 5.
TMS-EPs and ERPs on correct and error antisaccade trials. A, TMS-EPs at electrode P4 (marked with white circle in C) on correct and error antisaccade trials. B, ERPs on no-TMS trials at electrode FCZ (marked with white circle in D) on correct and error antisaccade trials. C, Scalp topography of TMS-EPs amplitude within the time window of 20–40 ms after TMS, separately shown for correct and error antisaccade trials. D, Scalp topography of ERPs amplitude within the time window of 420–440 ms after the cue onset, separately shown for correct and error antisaccade trials. E, Scalp topography of p values based on comparison by one-way ANOVA between correct and error antisaccade trials. Results are shown separately for TMS-EPs (left) and ERPs (right).

