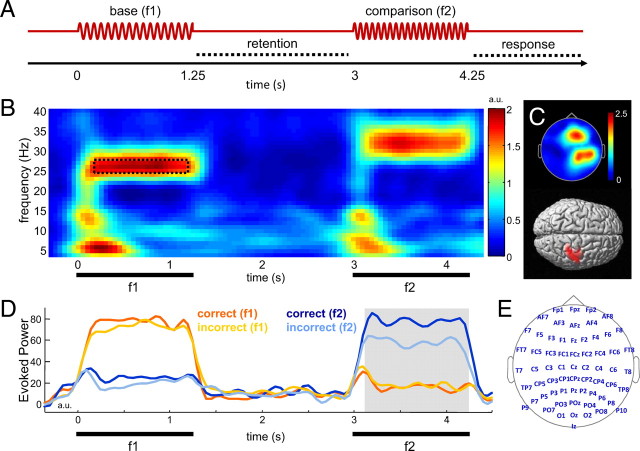
Figure 1.
A, Experimental paradigm. Vibrotactile stimuli of varying frequencies (16–41 Hz) were presented at the left index finger for subsequent frequency discrimination. B, C, Overview of stimulus-evoked responses observed during the task. B, Grand average evoked power for exemplary stimulus condition (f1, 26 Hz; f2, 31 Hz). For illustration, data were pooled over a representative set of channels (F1, Fz, F2, F4, FC1, FCz, FC2, FC4), in which both evoked and induced responses were observed (compare Fig. 2). The dashed rectangle highlights the time–frequency window of the steady-state evoked response to f1. C, Topography and SPM source reconstruction of the steady-state response in primary somatosensory cortex. Source rendering shows statistical parametric map of narrowband evoked activity at 26 Hz, compared with a condition in which f1 was 36 Hz. D, Steady-state evoked responses pooled over representative channels (see Results), expressed as the average narrow-band evoked power around the frequencies of the base (f1) and comparison (f2) stimuli, respectively. Data from equal-numbered subsets of correct and incorrect trials are shown; the gray shading indicates time window of a significant difference. E, Schematic of EEG electrode setup.

