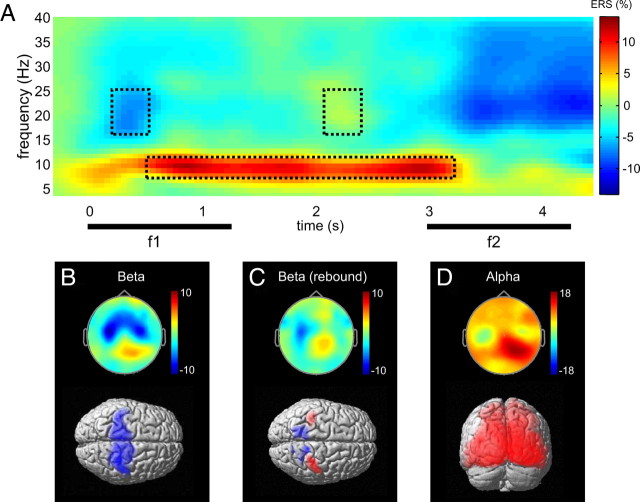
Figure 2.
Overview of induced responses observed during the task (A). Grand average induced power for the same stimulus condition and channels as in Figure 1B. The dashed rectangles highlight the time–frequency windows of the event-related beta ERD (left), subsequent beta rebound (right), and sustained alpha ERS (bottom). B–D, Scalp topographies and SPM source reconstructions for the TF windows outlined in A. Blue indicates a decrease (ERD), and red indicates an increase (ERS) in source power relative to prestimulus baseline. In D, results for a representative 500 ms time window are shown (750–1250 ms FWHM) (see Materials and Methods, Source localization).

