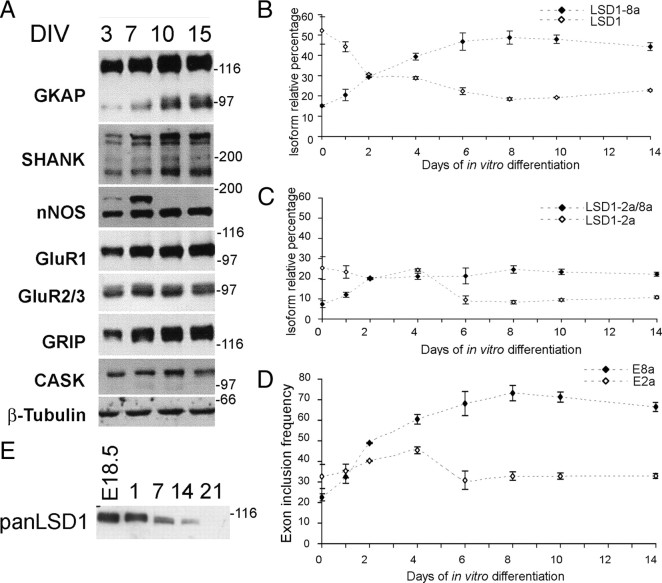
Figure 6.
LSD1 splicing analysis in a rat cortical neuron maturation system. A, In vitro maturation of cortical neurons prepared from E18.5 embryos (DIV0) was assessed by Western blot analysis of the indicated synaptic markers on total protein samples from the indicated DIV. Graphs represent the relative percentage of each isoform with respect to the sum of the four. Only two isoforms are shown per graph; B compares LSD1 isoform with LSD1-8a, whereas C compares LSD1-2a isoform with LSD1-2a/8a. Values shown are mean ± SD. D, Exon inclusion frequency of exons E2a and E8a. Each represented series relates to the overall inclusion of either E8a (black squares), calculated as the sum of LSD1-2a/8a and LSD1-8a relative percentage, and E2a (white squares), calculated as the sum of LSD1-2a and LSD1-2a/8a relative percentage, at each indicated developmental stage. E, Western blot on total protein samples from the indicated DIV with a panLSD1 antibody.

