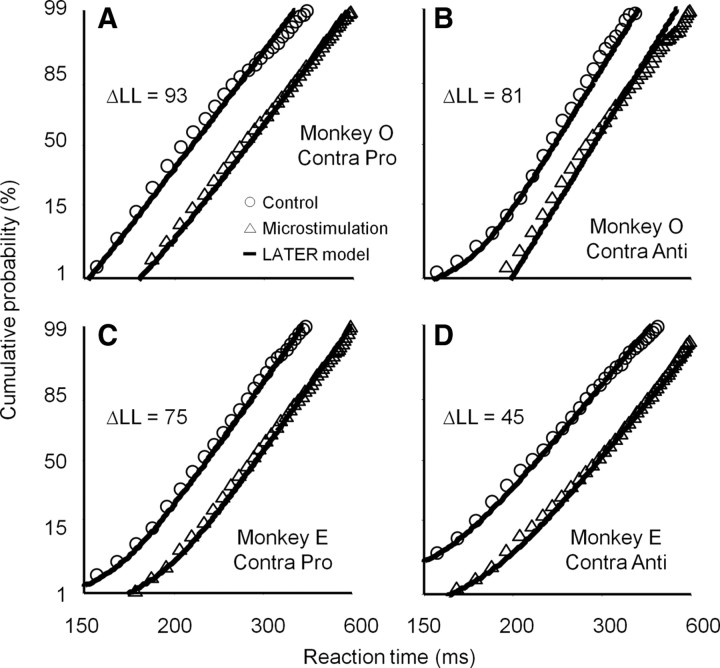
Figure 6.
LATER model for contralateral saccades with alteration in rate of rise. A, Prosaccade trials in monkey O. B, Antisaccade trials in monkey O. C, Prosaccade trials in monkey E. D, Antisaccade trials in monkey E. Stimulation sites in which microstimulation prolonged reaction times (t test p < 0.05) were collapsed. Circles and triangles indicate cumulative distributions of reaction times with 10 ms bin width on control and microstimulation trials, respectively. Continuous lines indicate the results of LATER model fittings under the constraint of alteration in the rate of rise to the threshold for saccade initiation. Fitting results under the constraint of alteration in the distance between the baseline and threshold are shown in supplemental Figure 3, available at www.jneurosci.org as supplemental material. The summary of fitting results is shown in Table 1. See also supplemental Figures 4 and 5, available at www.jneurosci.org as supplemental material, for the fitting results of ipsilateral saccades.

