
Figure 2.
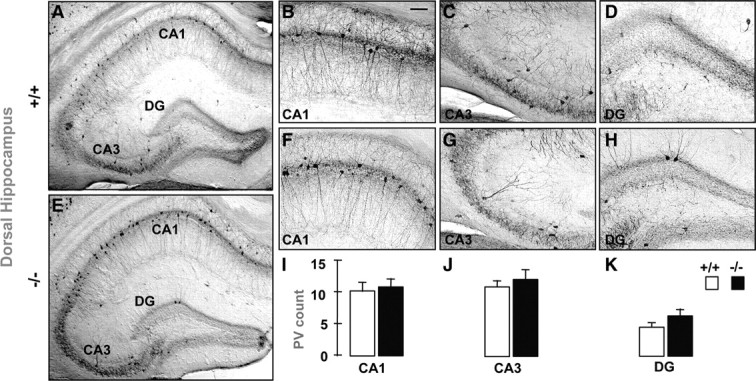
A–H, Parvalbumin-immunoreactive (PV-IR) profiles in the dorsal hippocampus of adult GCLM +/+ (A–D) and GCLM −/− (E–H) mice. Micrographs show coronal sections of the entire hippocampus (A, E), and parts of CA1 (B, F), CA3 (C, G), and dendate gyrus (DG) (D, H) where PV-IR cells are clearly visible. The coronal sections were taken ∼−3.1 mm bregma and 5.5 mm above the interaural line. I–K, Stereological quantification shows for all subregions that the number of PV-IR FSI (mean ± SEM) does not differ in GCLM −/− (n = 9) and +/+ (n = 9) mice. Scale bar: 50 μm.