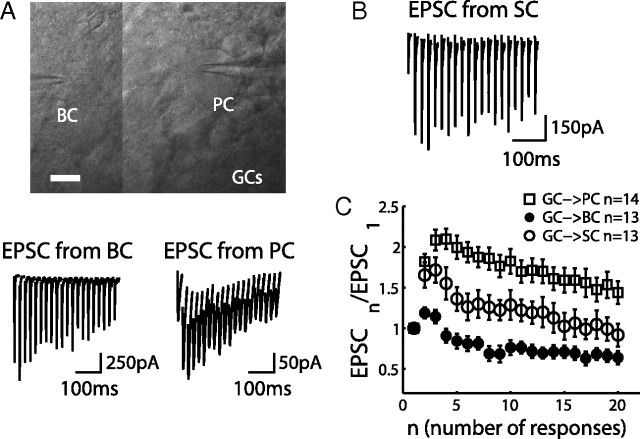
Figure 2.
Target-dependent plasticity of granule cell synapses. A, Imaging of simultaneous patch-clamp recording from Purkinje cell and basket cell (scale bar, 10 μm). EPSCs recorded from the BC during 50 Hz GC stimulations are depressing, and those recorded from the PC are facilitating. Cells were voltage clamped at −65 mV and in the presence of SR 95531. Each trace is an average of 10 sweeps. B, EPSCs of an SC under the same experiment condition as in A. C, Peak amplitudes of EPSCs recorded during the train are normalized to the first one and plotted against the number of responses. Each trace represents an average from 14 PCs (open squares), 13 BCs (filled circles), and 13 SCs (open circles) (mean ± SEM).

