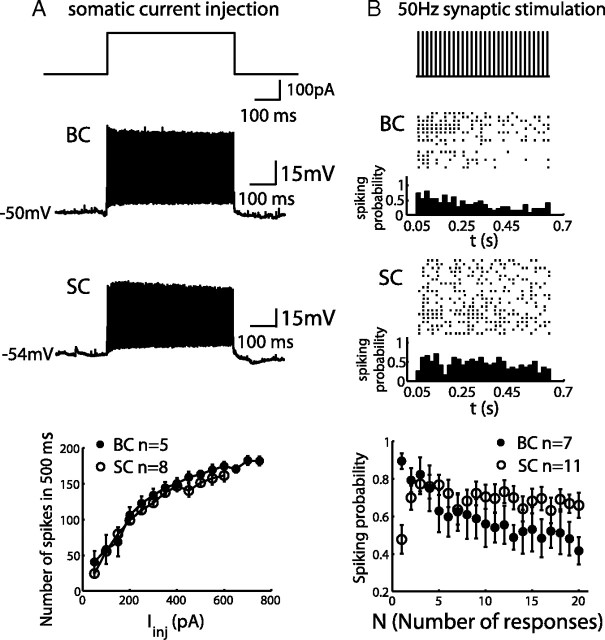
Figure 4.
Spiking of interneurons in FFI circuit. A, A 200 pA current injection to the soma of BCs and SCs induced 140 Hz regular spike output of the example BCs and 165 Hz regular spike output of the SCs (top). Averaged spike counts within 500 ms were plotted against the amplitudes of injected currents (bottom). B, Spikes were detected from BCs and SCs and plotted as a raster plot during a 50 Hz train of granule cell stimulation. Spikes were counted from a 5 ms time window after each stimulation pulse. Spiking probabilities are plotted beneath the raster plot. Summarized spiking probability is shown for both cell types (bottom).

