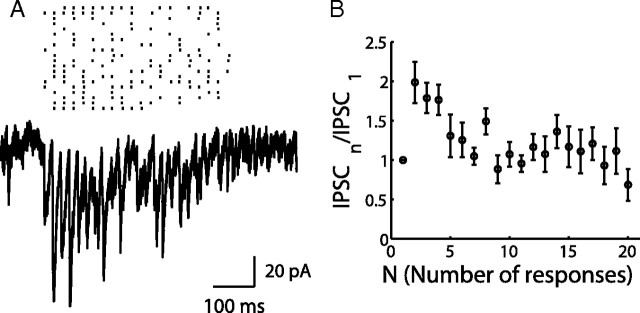
Figure 6.
SC → PC connection with realistic firing pattern of SC under 50 Hz GC stimulation. A, Firing patterns of an example SC in response to the GC stimulation at 50 Hz (Fig. 4B) was applied to stellate cells. Twenty different patterns were applied, and the resulting IPSCs from the PC were averaged (bottom trace). B, The summary of normalized peak amplitudes from seven cells.

