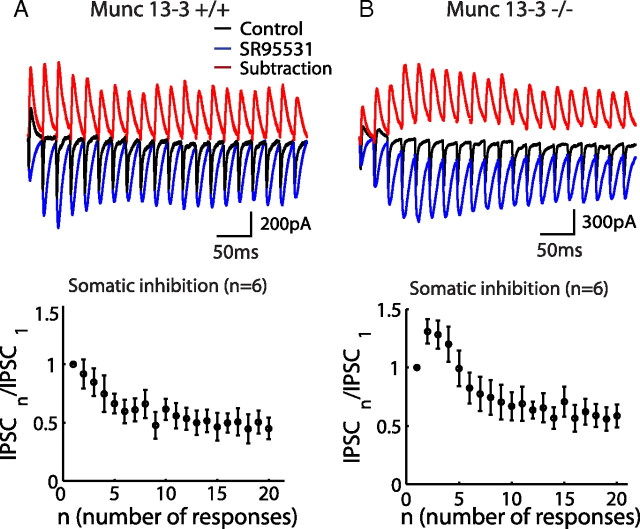
Figure 8.
Phasic somatic inhibition. A, Somatic recorded PSCs from a PC under 50 Hz GC stimulations are shown in both control (black) and SR 95531 (blue) conditions (top). Subtracting the two traces gave an estimation of somatic IPSCs (red). Normalized IPSCs were averaged from six cells showing 48 ± 1.5% steady-state depression. B, The same experiment as in A, but the data were obtained from Munc13-3 KO mice.

