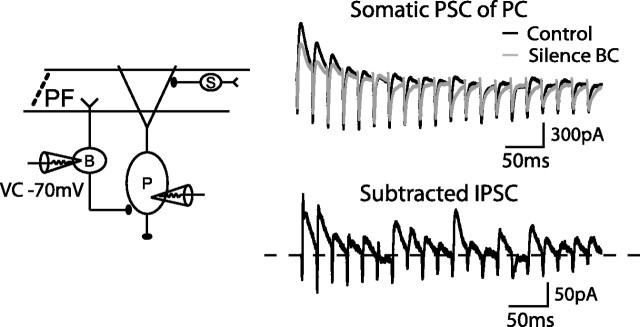
Figure 9.
Silencing a single basket cell indicates phasic somatic inhibition. A diagram showing the experimental scheme of silencing one BC by voltage clamping the BC at −70 mV during a paired recording of BC and PC (left). Somatic PSCs recorded from the PC under 50 Hz GC stimulations are shown in control condition (black, when the BC is under current-clamp mode) and in the condition when the BC is silenced (gray). Subtracting the two traces shows the IPSCs delivered by one BC onto the soma of the PC (bottom panel, right). Zero level is indicated as a dotted line. An average of 40 ± 5.8% steady-state depression was observed from four cells. B, Basket cell; P, Purkinje cell; S, Stellate cell.

