Figure 8.

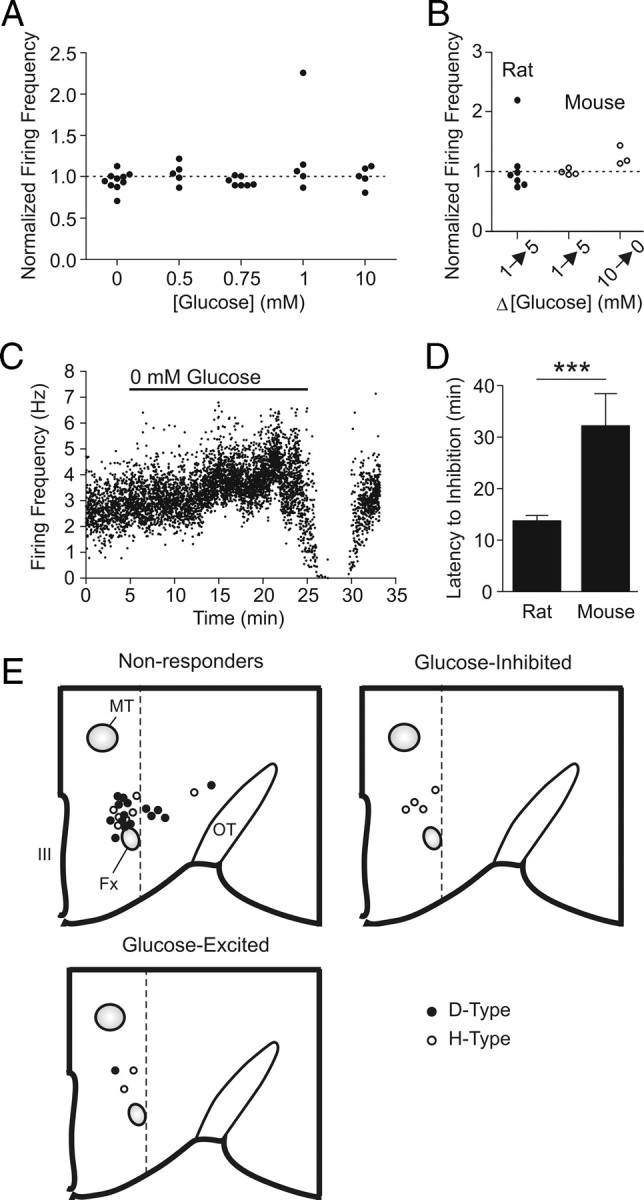
Lack of consistent short-term glucose effects on action potential firing. A, Normalized firing frequency of rat orexin neurons during the acute phase (2–5 min) of a new glucose concentration as indicated, from a baseline of 2.5 mm. For the 0 mm experiments, a subset of cells was exposed to a baseline of 10 mm glucose. B, Normalized firing frequency of orexin neurons after glucose changes as indicated in rats (filled circles) and mice (hollow circles). For experiments on rats, ACSF and pipette solutions were adapted from previous studies (Burdakov et al., 2006; González et al., 2008). C, D, Glucose deprivation-induced inhibition is also present in mouse orexin neurons, albeit with a longer latency compared with rats (D). Glucose deprivation exceeding 20 min was tested on some mouse orexin neurons. E, Schematic of recorded orexin neurons in a hemisected hypothalamus showing the location, electrophysiological type (D vs H) and short-term responsiveness to glucose. Bilateral and anteroposterior dispersal is collapsed into one map to display the distribution pattern relative to the fornix and the third ventricle. Only cells of which the location could be clearly identified by post hoc immunofluorescence labeling are shown. Fx, Fornix; MT, mammillothalamic tract; OT, optic tract; III, third ventricle. The dotted lines denote the lateral border between the perifornical area and lateral hypothalamus. ***p < 0.001. Error bars indicate SEM.
