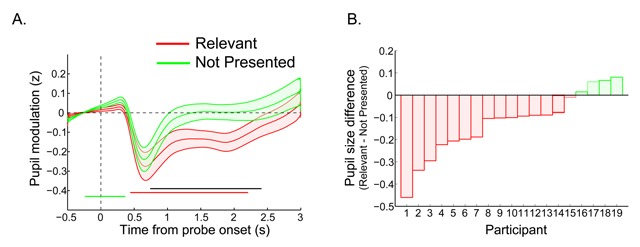
Figure 2.

A) The time course of the pupil response for Experiment 1: The probe was presented at time zero. The thick lines indicate the mean pupil diameter, and the shaded areas indicate the standard error (SEs) across subjects. Colored (horizontal) bars indicate clusters of significant modulations; black line indicates significant differences between colored traces (p < 0.05 cluster corrected, N = 19). B) Average pupil effect per participant: A negative value indicates that the pupil was smaller when the probe matched the relevant color. Per subject we calculated the mean pupil size in the interval 740 to 2410 ms in the Relevant condition and subtracted the mean size of the Not Presented condition.
