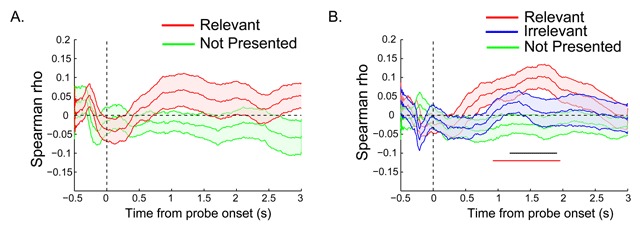
Figure 4.

A) The time course of RT by pupil response correlation for Experiment 1 and B) Experiment 2: The probe was presented at time zero. The thick lines indicate the mean Spearman rank correlation, and the shaded areas indicate the standard error (SEs) across subjects. Colored (horizontal) bars indicate clusters of significant correlation (i.e., rs different from zero). Black bar in B corresponds to the difference between the Relevant and Not Presented condition (p < 0.05 cluster corrected).
