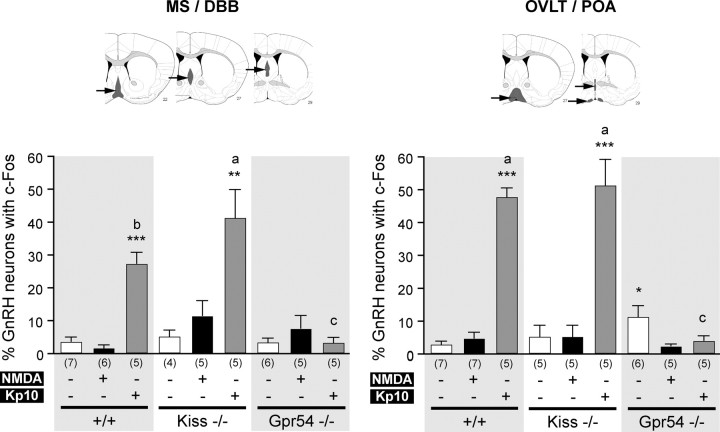
Figure 6.
Quantification of GnRH neurons with c-Fos expression after central injections. Bar graphs represent the percentage of GnRH neurons expressing c-Fos (mean ± SEM) in the MS/DBB (left) or in the OVLT/POA (right) regions. Arrows indicate gray regions on the brain map. In each region, bar graphs show percentage of GnRH neurons (mean ± SEM) with c-Fos in wild-type (+/+), Kiss1-null (Kiss−/−), and Gpr54-null (Gpr54−/−) mice before (0) and 10 min after PBS (white bars), NMDA (black bars), or Kp10 (gray bars) intracerebroventricular injection. *p < 0.05, **p < 0.01, ***p < 0.001 when different treatments on same genotype were compared. a vs c, p < 0.001; b vs c, p < 0.01; a vs b, not significant when different genotypes were compared with the same treatment in the same subpopulation (one-way ANOVA, followed with Student–Newman–Keuls test in both comparison tests). Numbers in brackets indicate animal number used in each condition.

